

Back to futurelearn
Topic 4A - Introduction To Monitoring The Oceans
Featured Images and Example Data
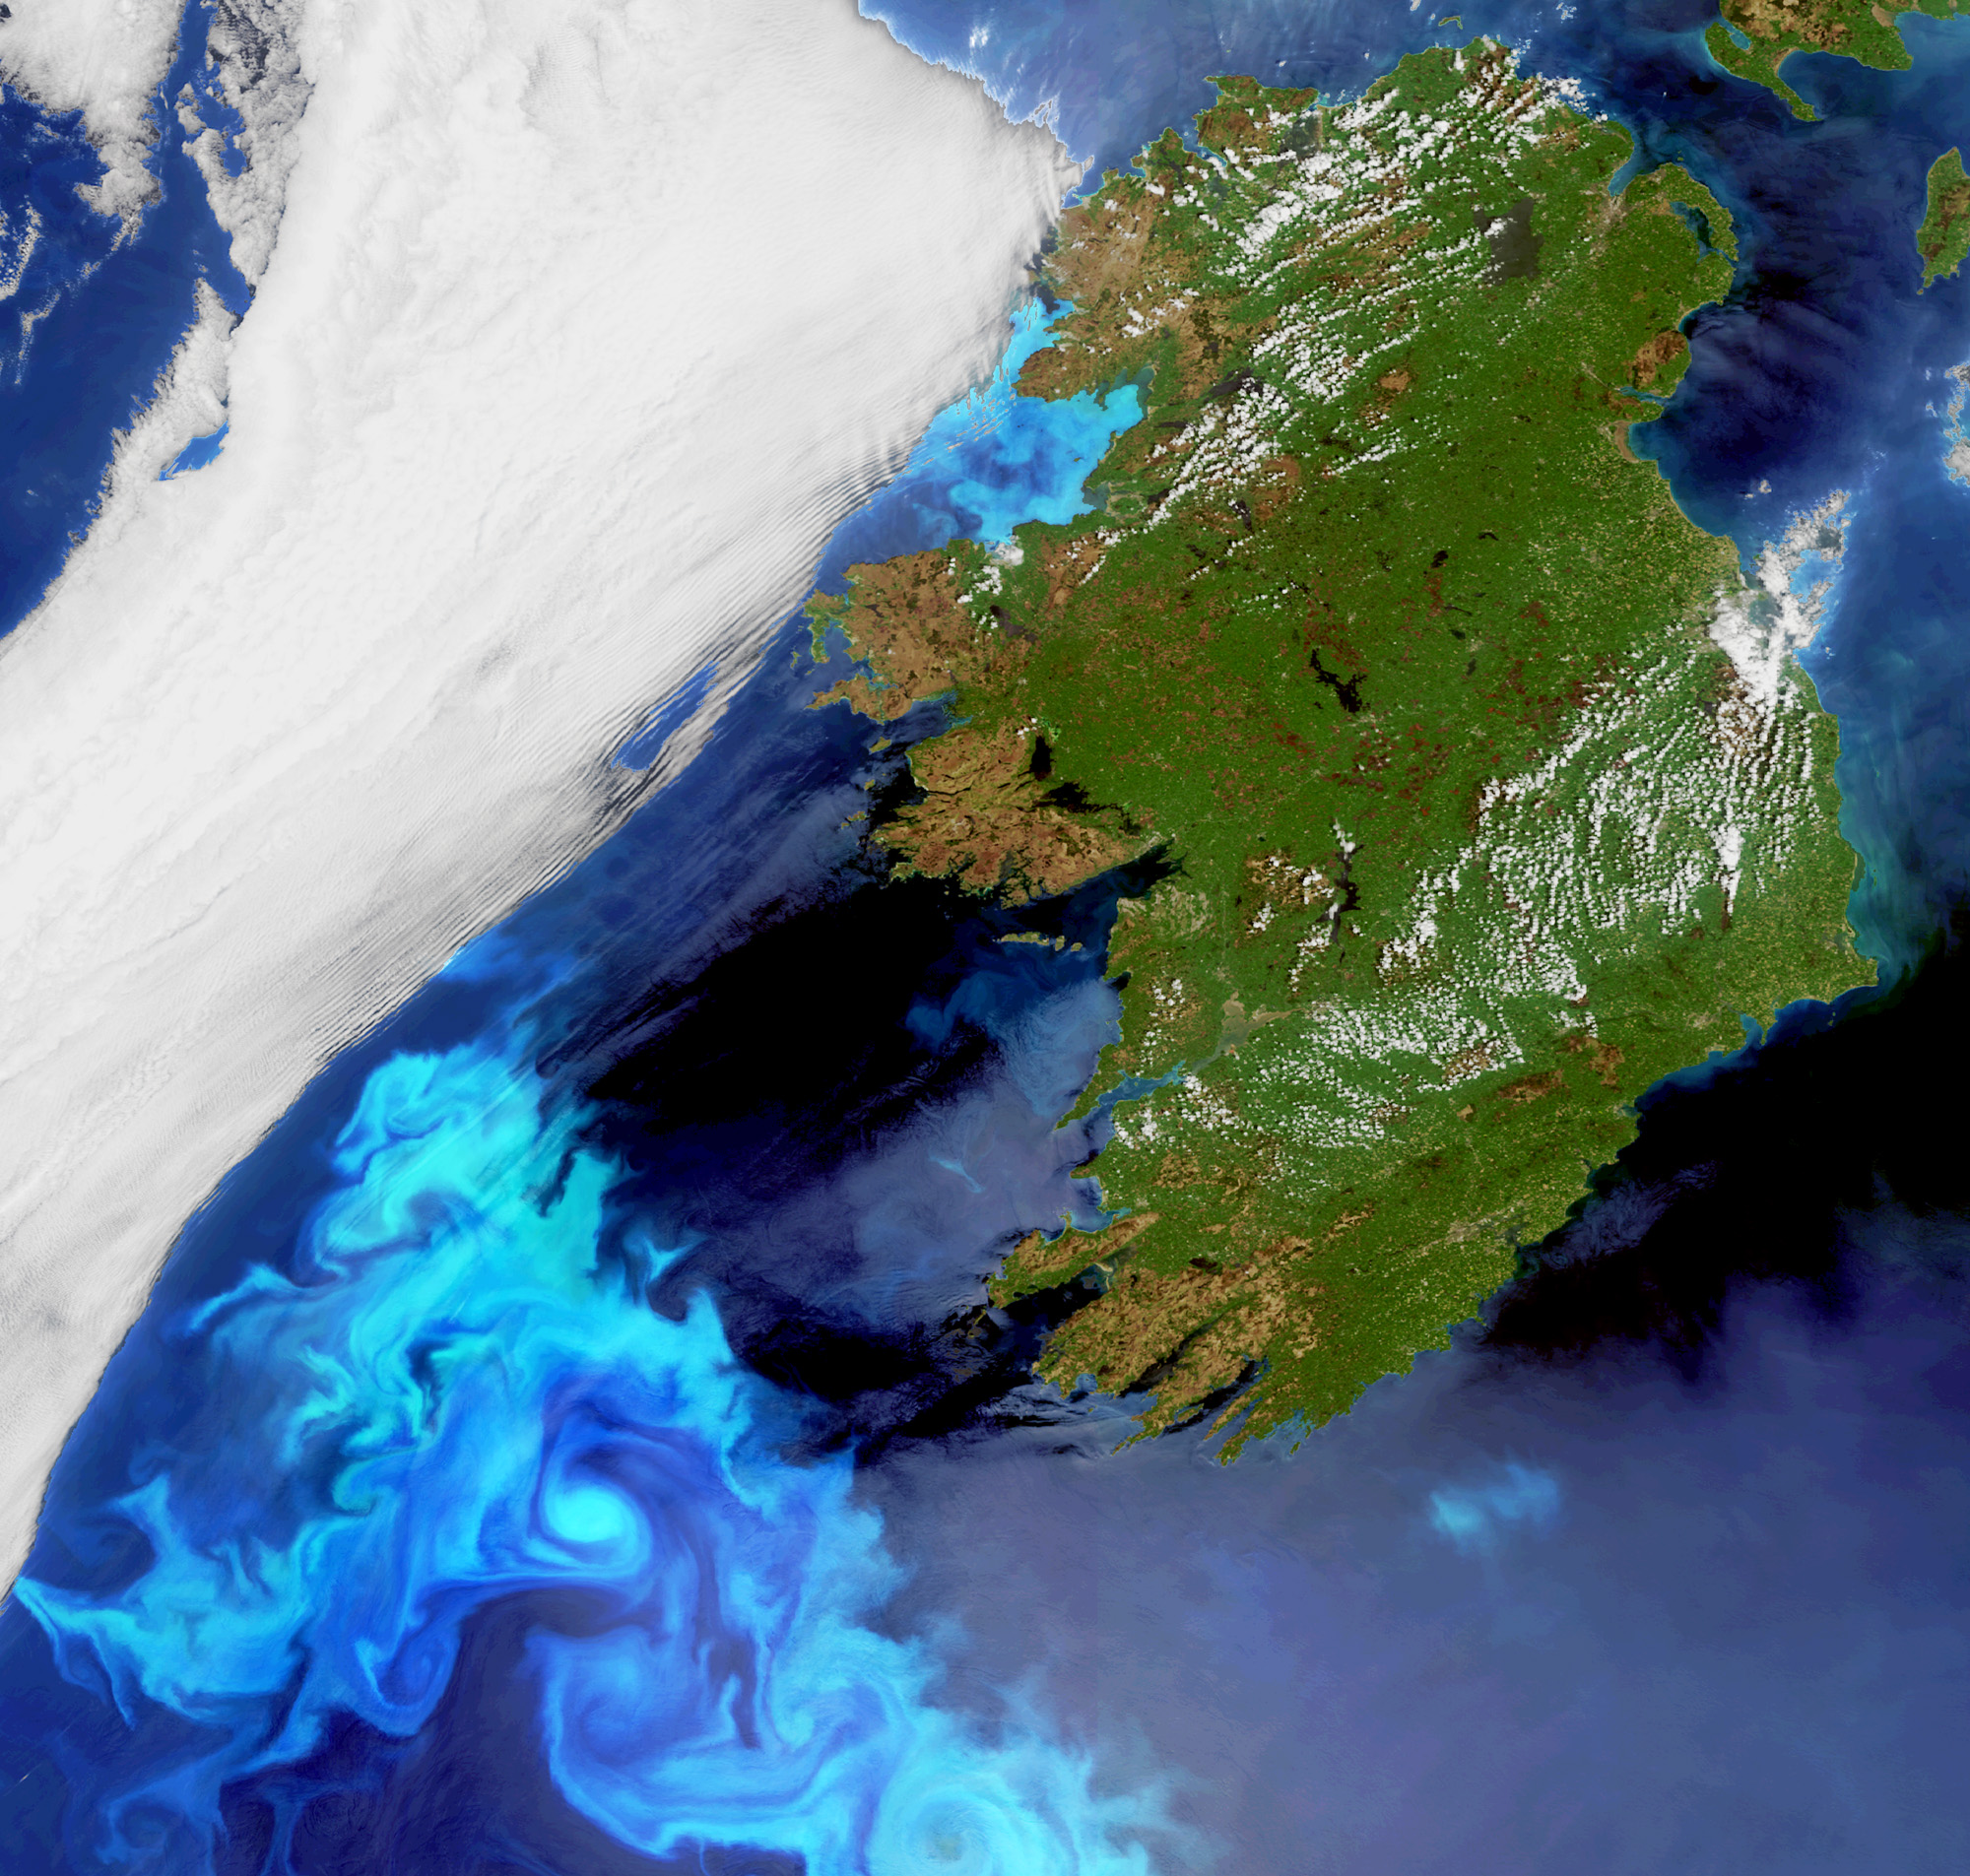
Algal bloom off Ireland
Image of algae bloom off irelands west coast taken by ENVISATs MERIS instrument
©
ESA
Source Link
Remote sensing of ocean-atmosphere interactions
Conceptual view of (a) oceanic and atmospheric processes influencing air-sea interactions, and (b) corresponding properties observable by remote sensing
©
Griet Neukermans et al., 2018
Source Link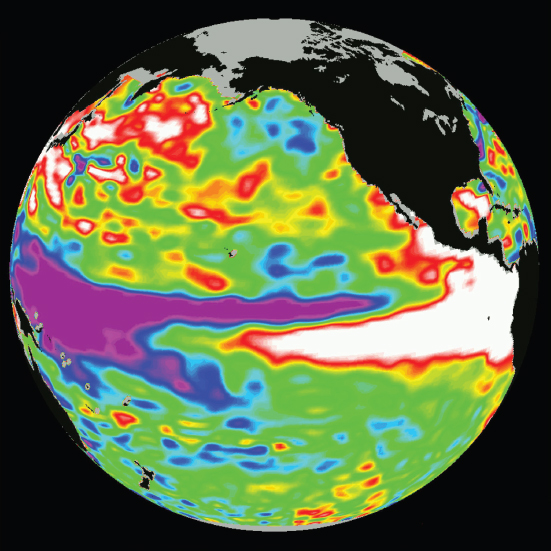
Sea surface height, Pacific Ocean
This image of the Pacific Ocean was produced using sea surface height measurements taken by the U.S./French TOPEX/Poseidon satellite. The image shows sea surface height relative to normal ocean conditions on Dec. 1, 1997.
©
NASA/JPL
Source Link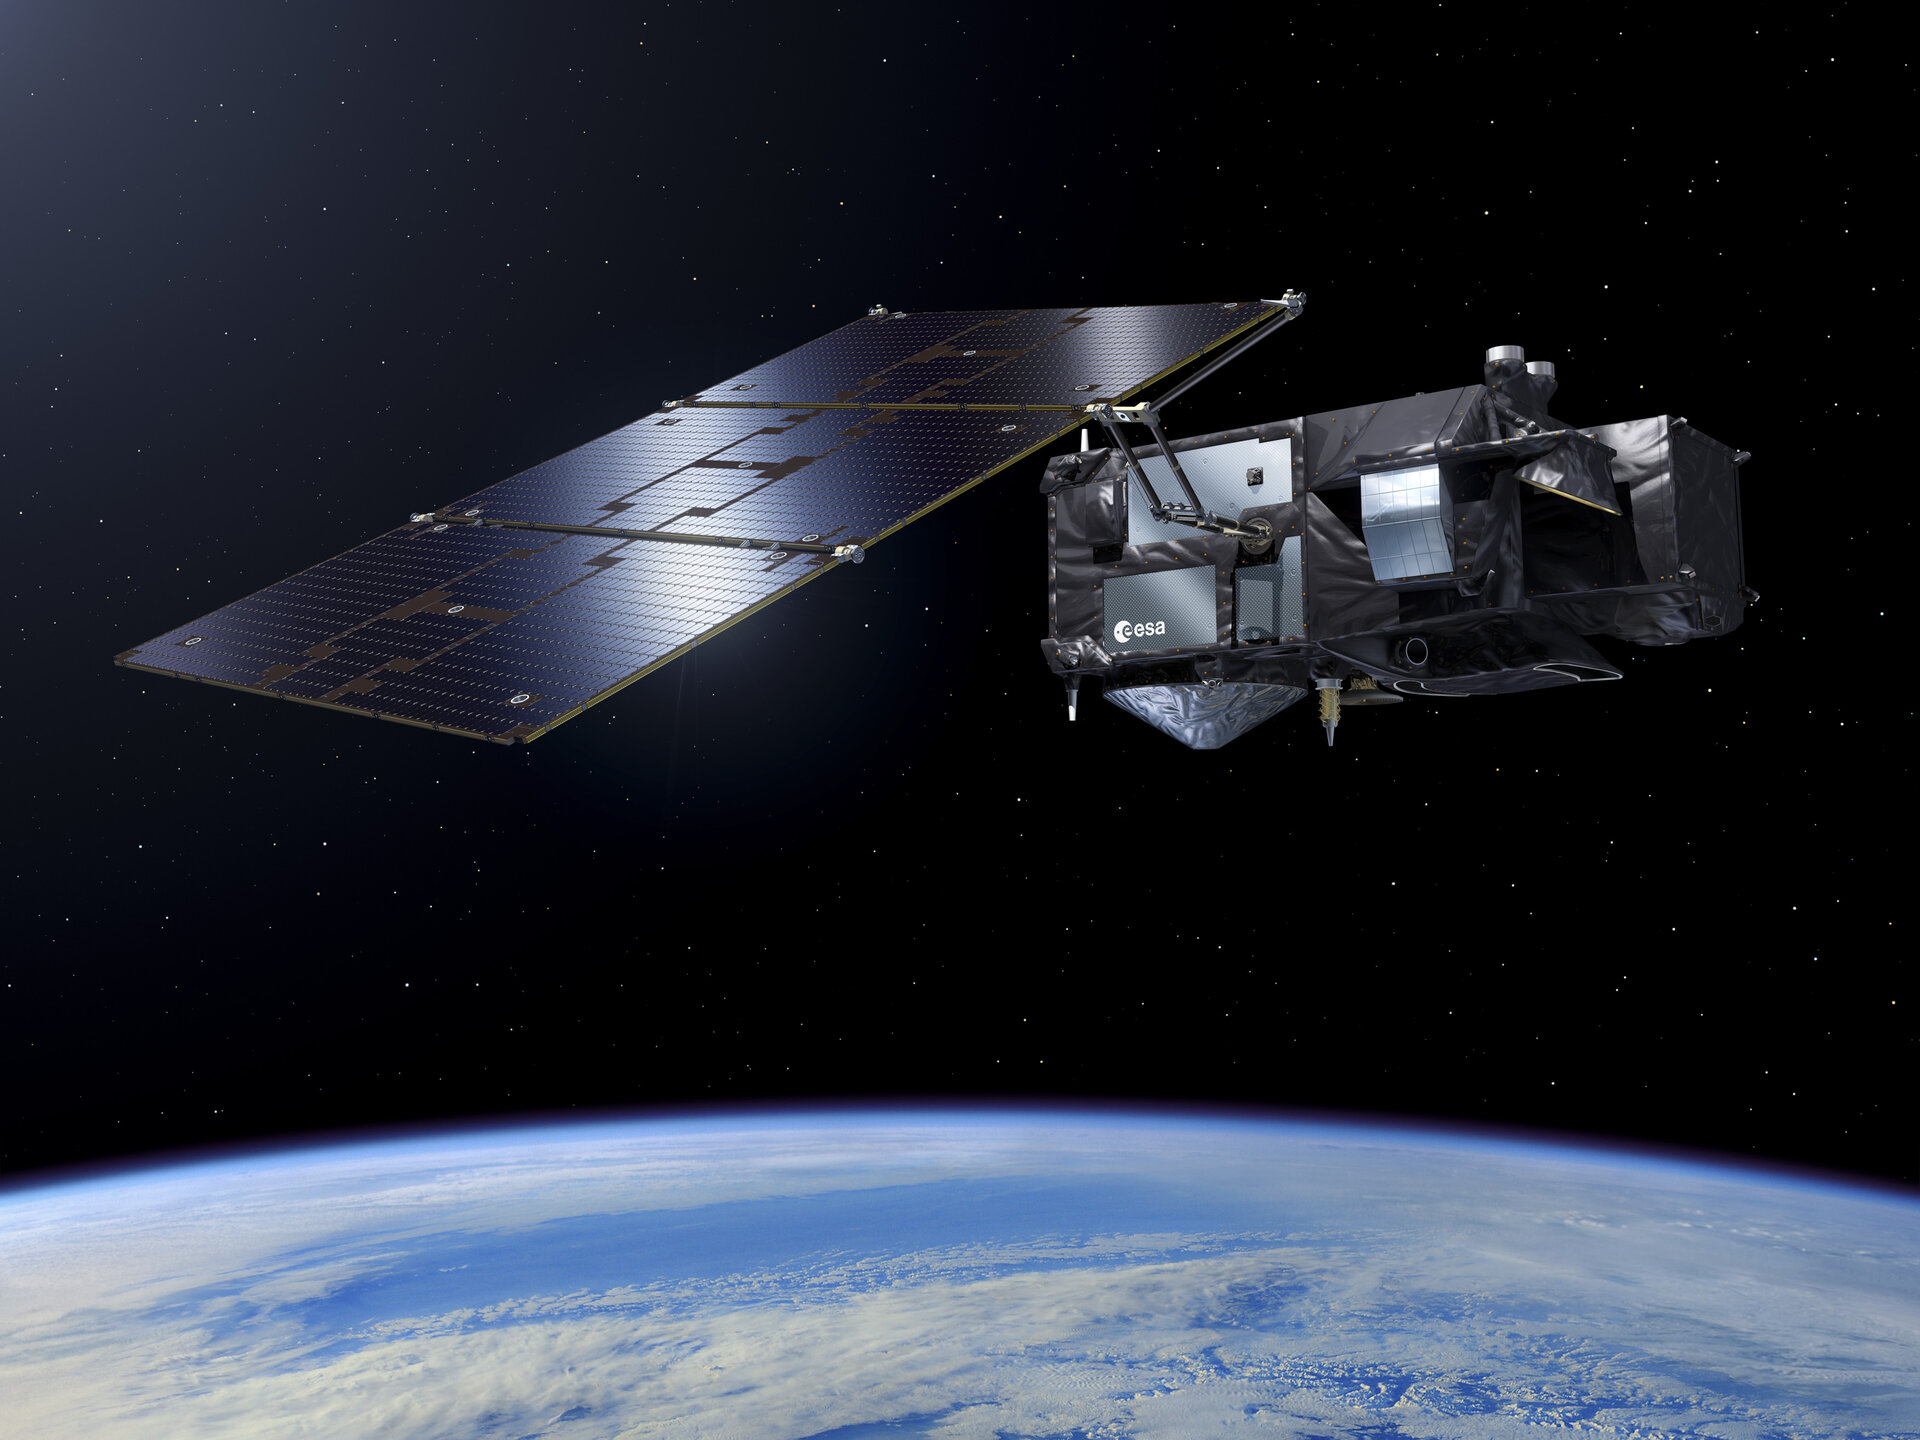
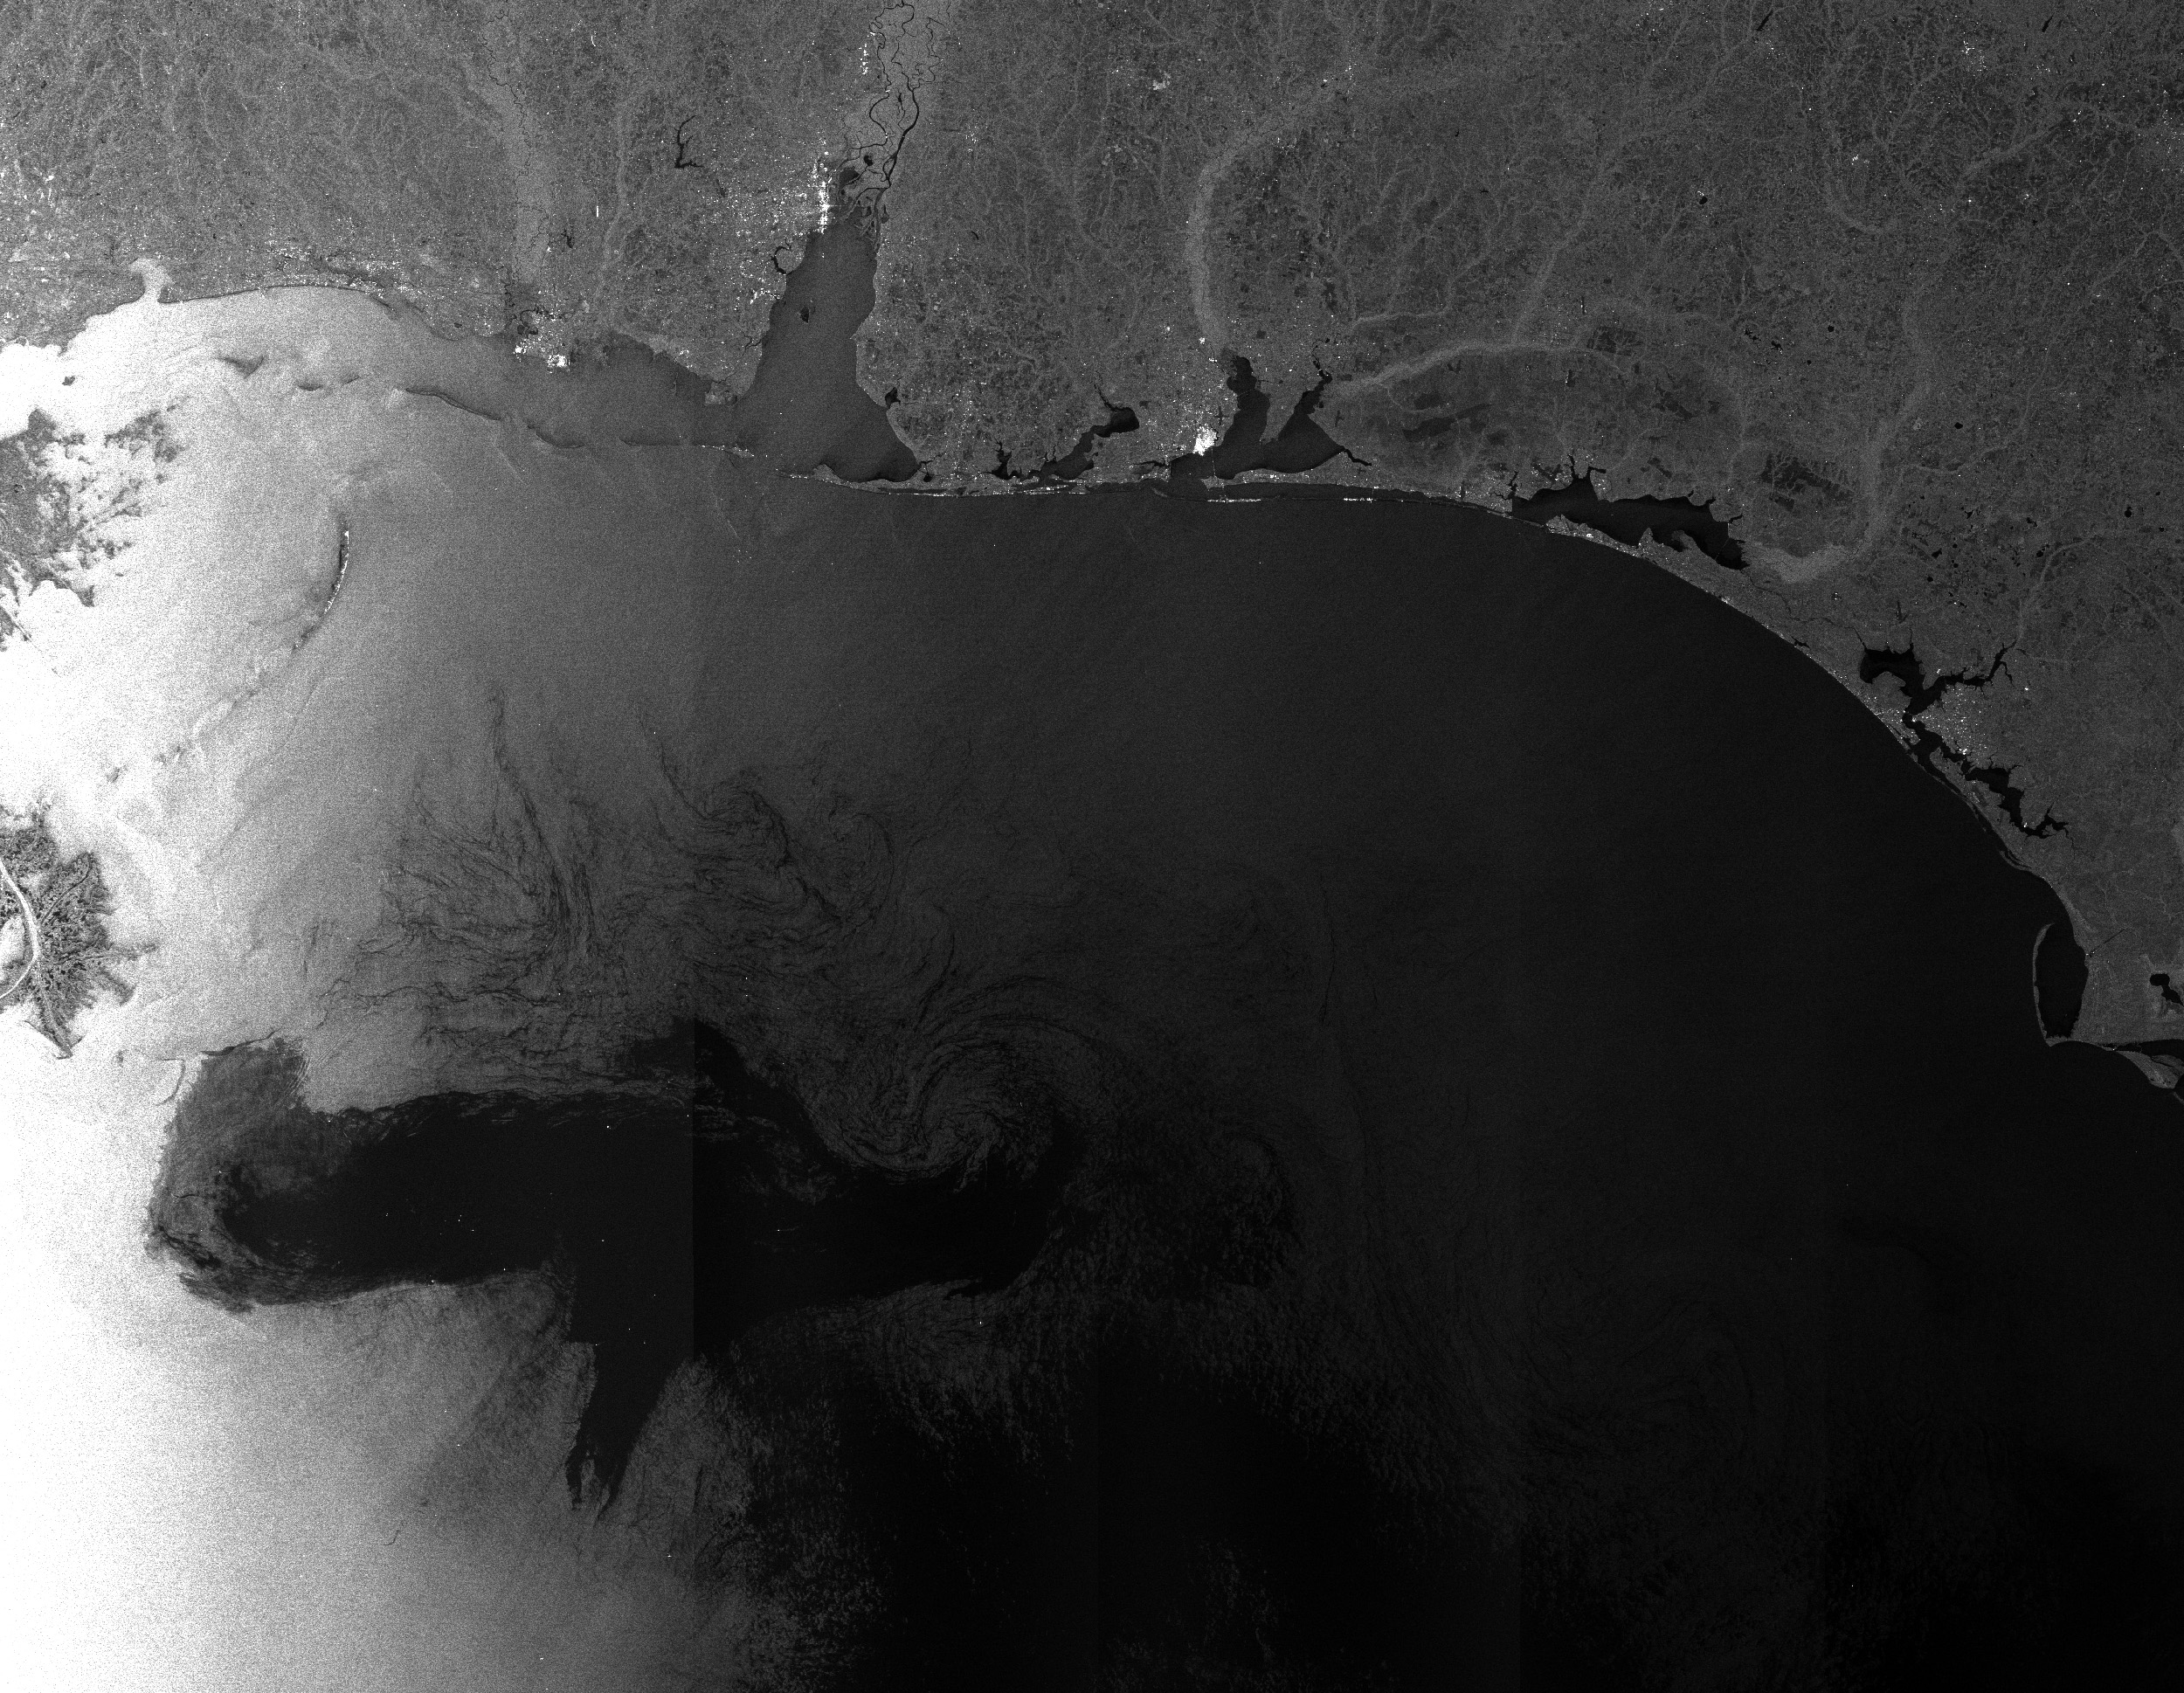
Oil spill in the Gulf of Mexico
In this image, acquired by Envisat's Advanced Synthetic Aperture Radar instrument on 28 April 2010 at 03:45 UTC, the oil spill is visible as a lighter grey whirl on the left side of the large black pattern stretching across the Gulf.
©
ESA
Source Link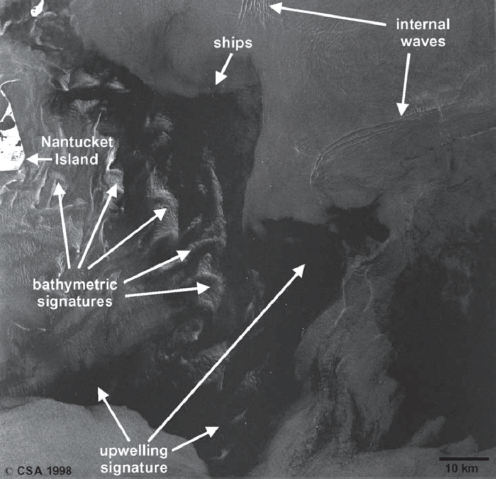
SAR images of oceanographic features
This is a Synthetic Aperture Radar (SAR) image showing oceanographic features just off of Nantucket Island, Massachusetts, USA
©
Canadian Space Agency
Source Link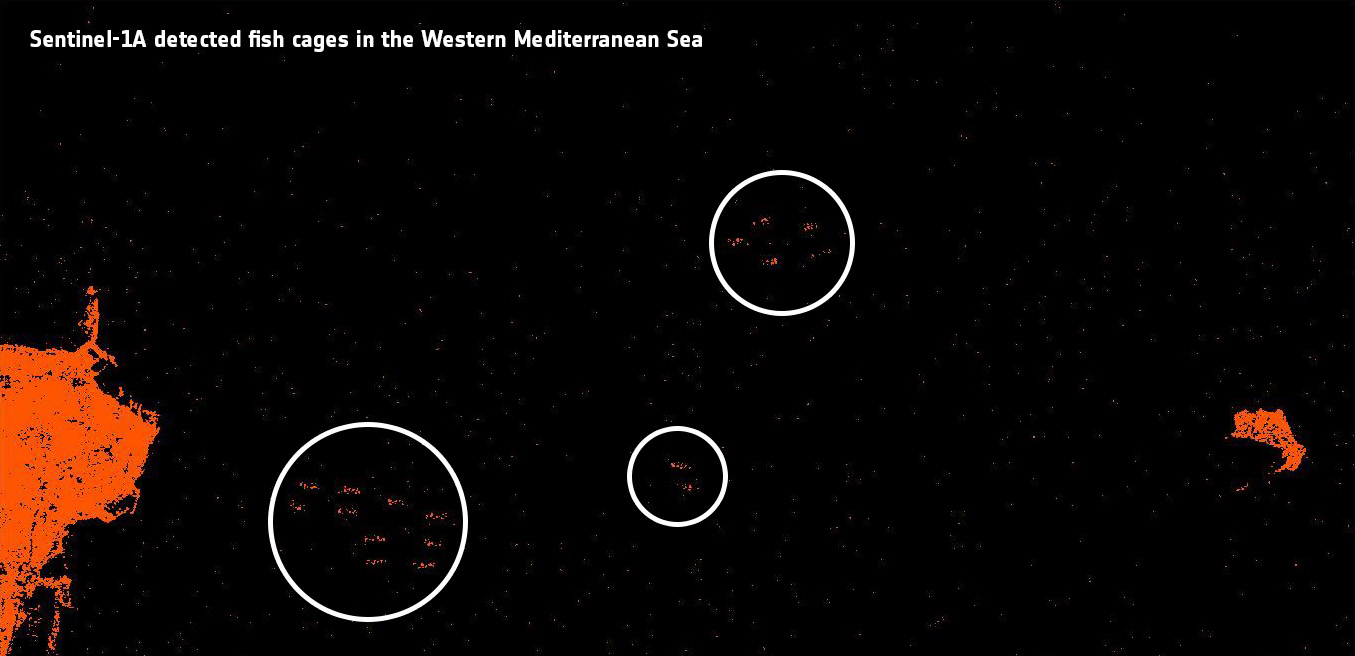
Sentinel-1A detects fishing cages
The Sentinel-1A satellite counts fishing cages in the western Mediterranean Sea.
©
Contains modified Copernicus Sentinel data [2016] /ESA/ACRI
Source Link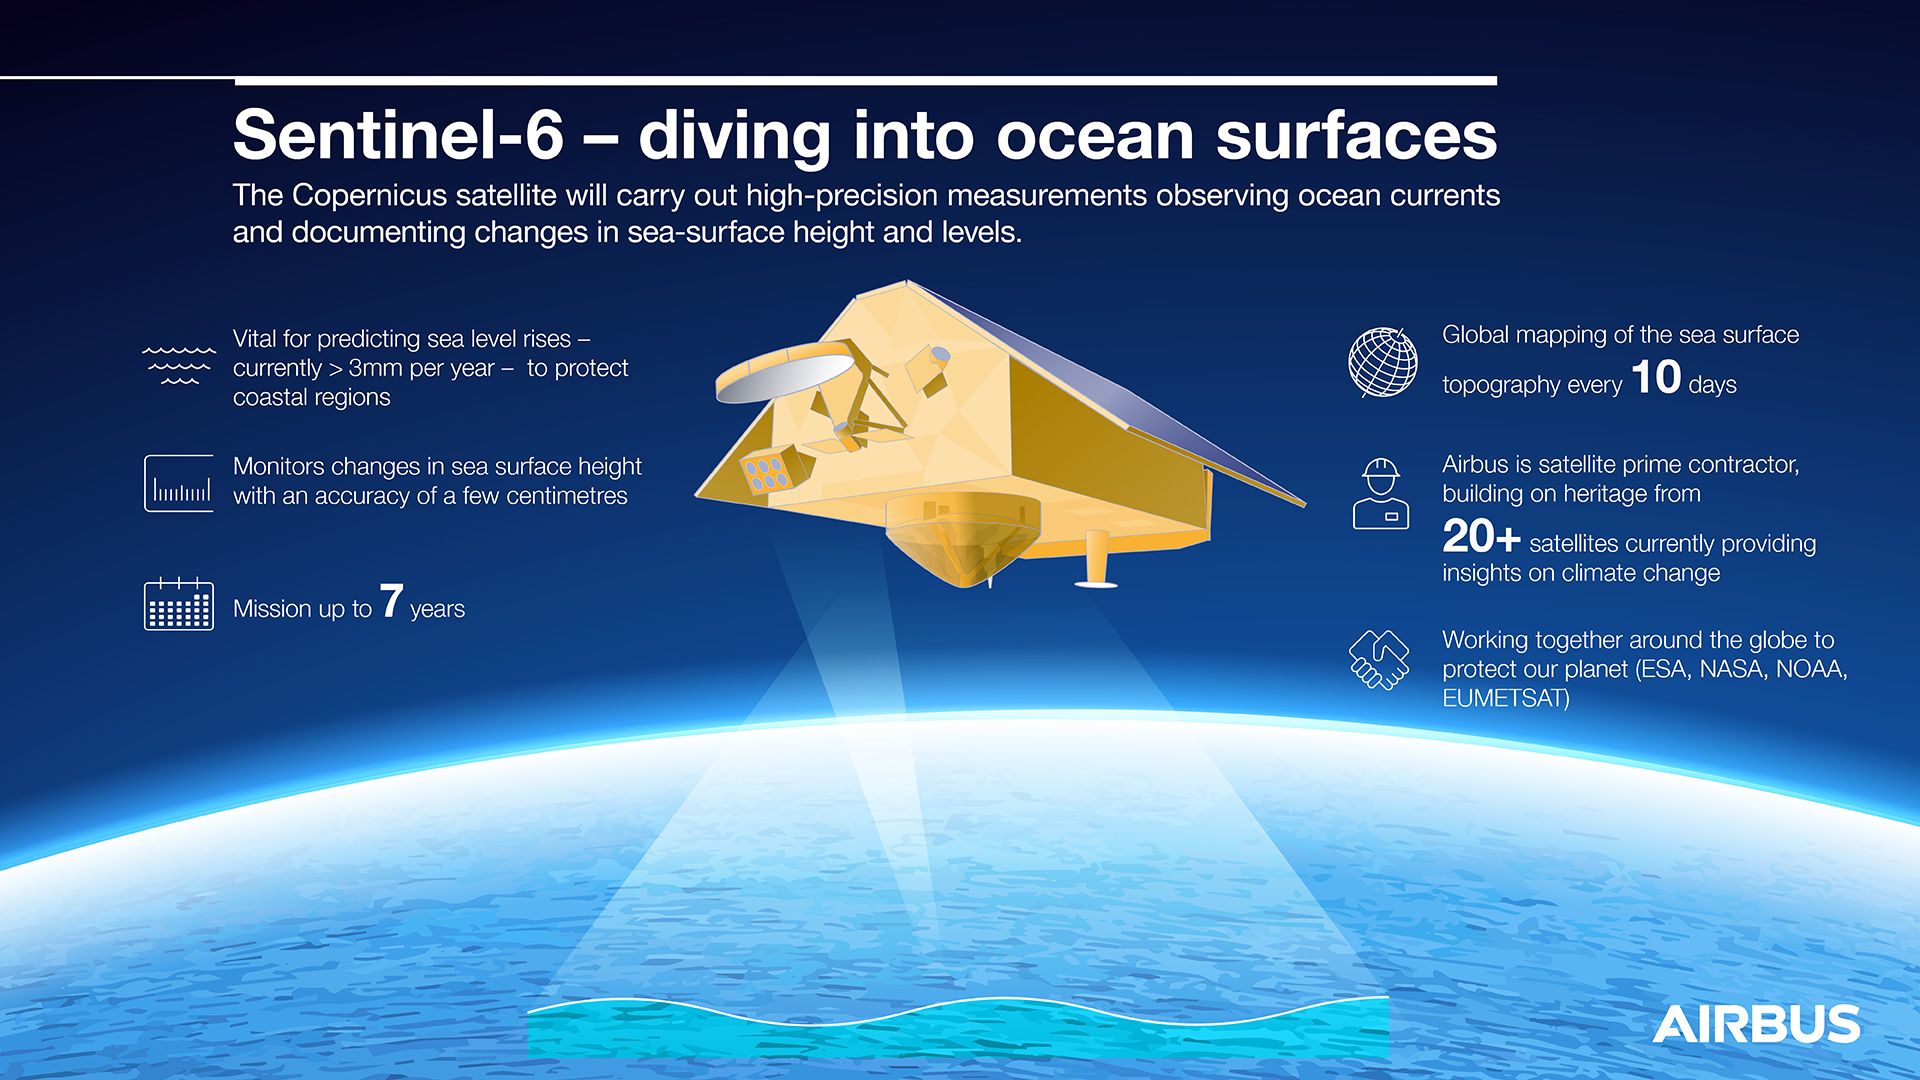
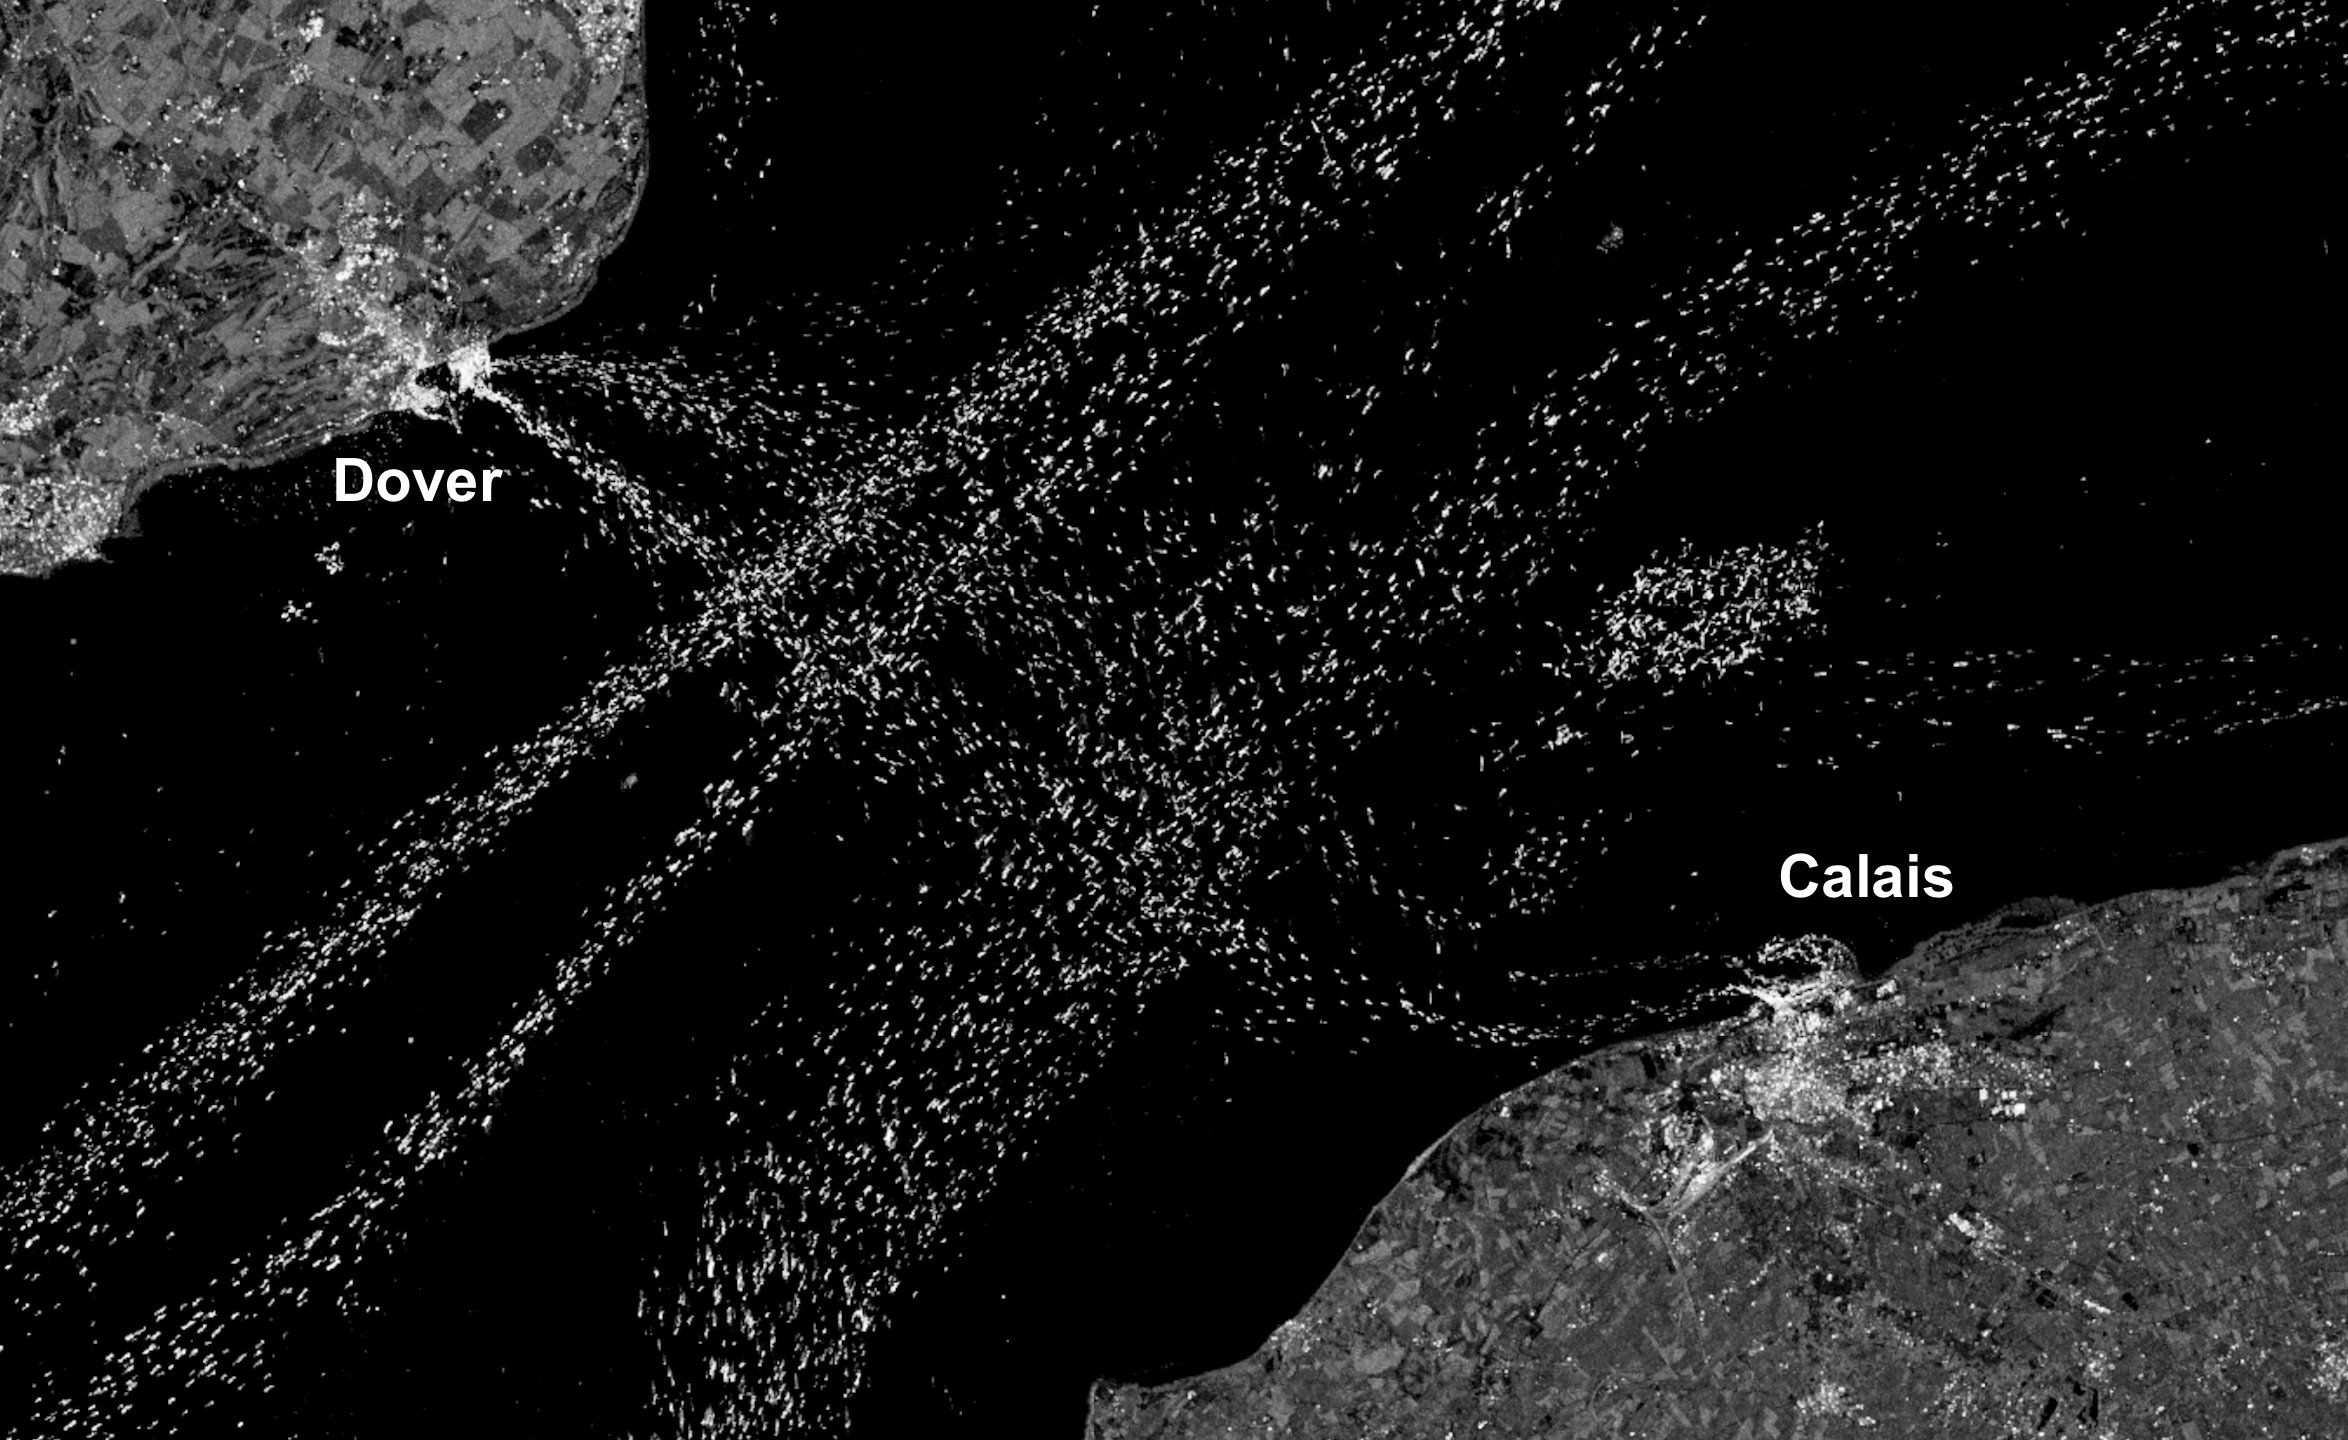
Maritime traffic in the English channel
This image is a composite of maritime traffic in the English channel from Sentinel-1 between 1st January 2015 - 1st January 2019
©
Simon Gascoin/CNES/Copernicus Sentinel-1
Source Link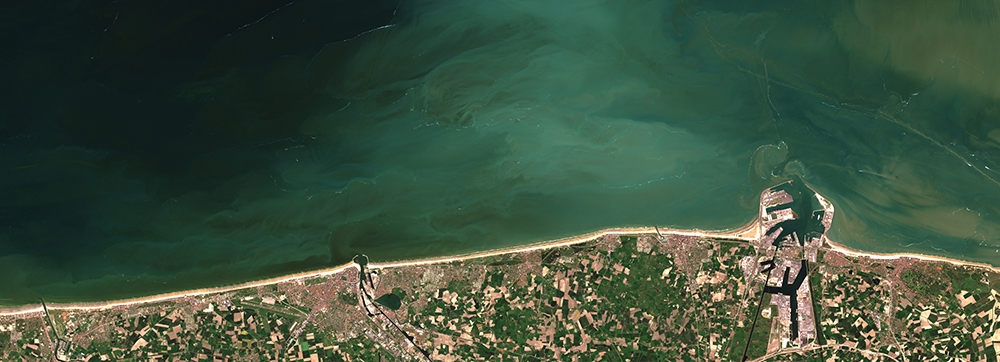
Algal bloom off Belgian coast
On 1 May 2016, the Sentinel-2A satellite captured an algal bloom close to Belgium’s coast.
©
contains modified Copernicus Sentinel data (2016), processed by RBINS
Source LinkFeatured Video and Animations

Sentinel-3 scans Earth's colour
Animation of Sentinel-3 using it's Ocean and Land Colour Instrument (OLCI) instrument
©
ESA/ATG medialab
Source Link
Copernicus Marine Data
This video shows what types of data is available from the Copernicus Marine Service
©
Copernicus Marine Service/ Mercator Ocean
Source Link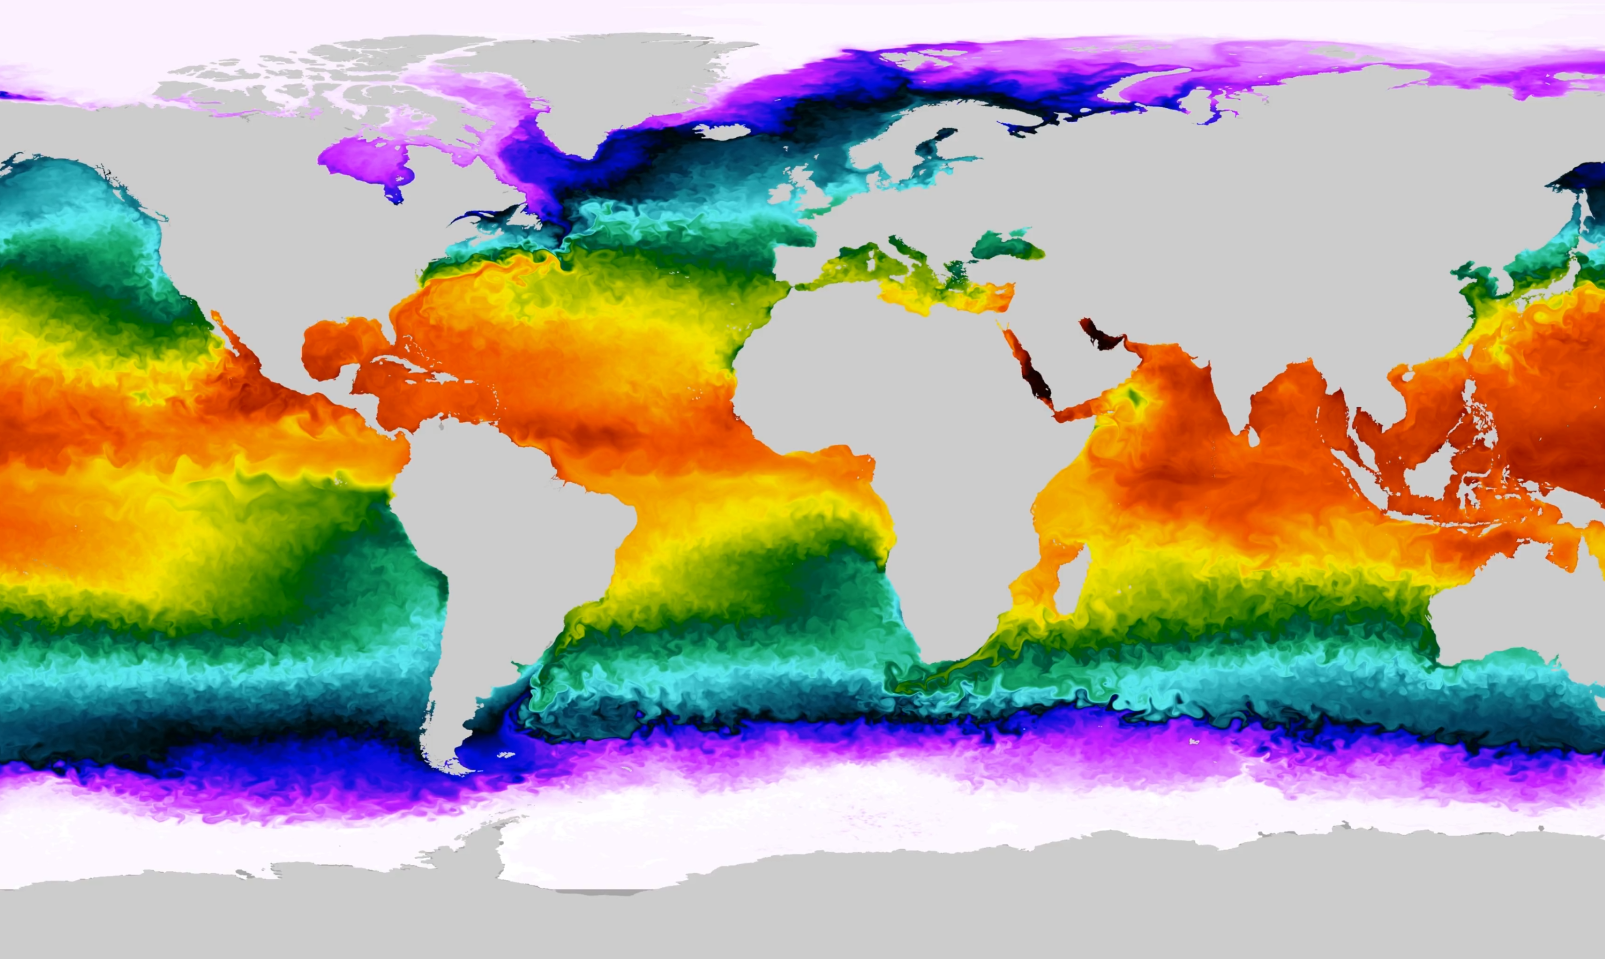
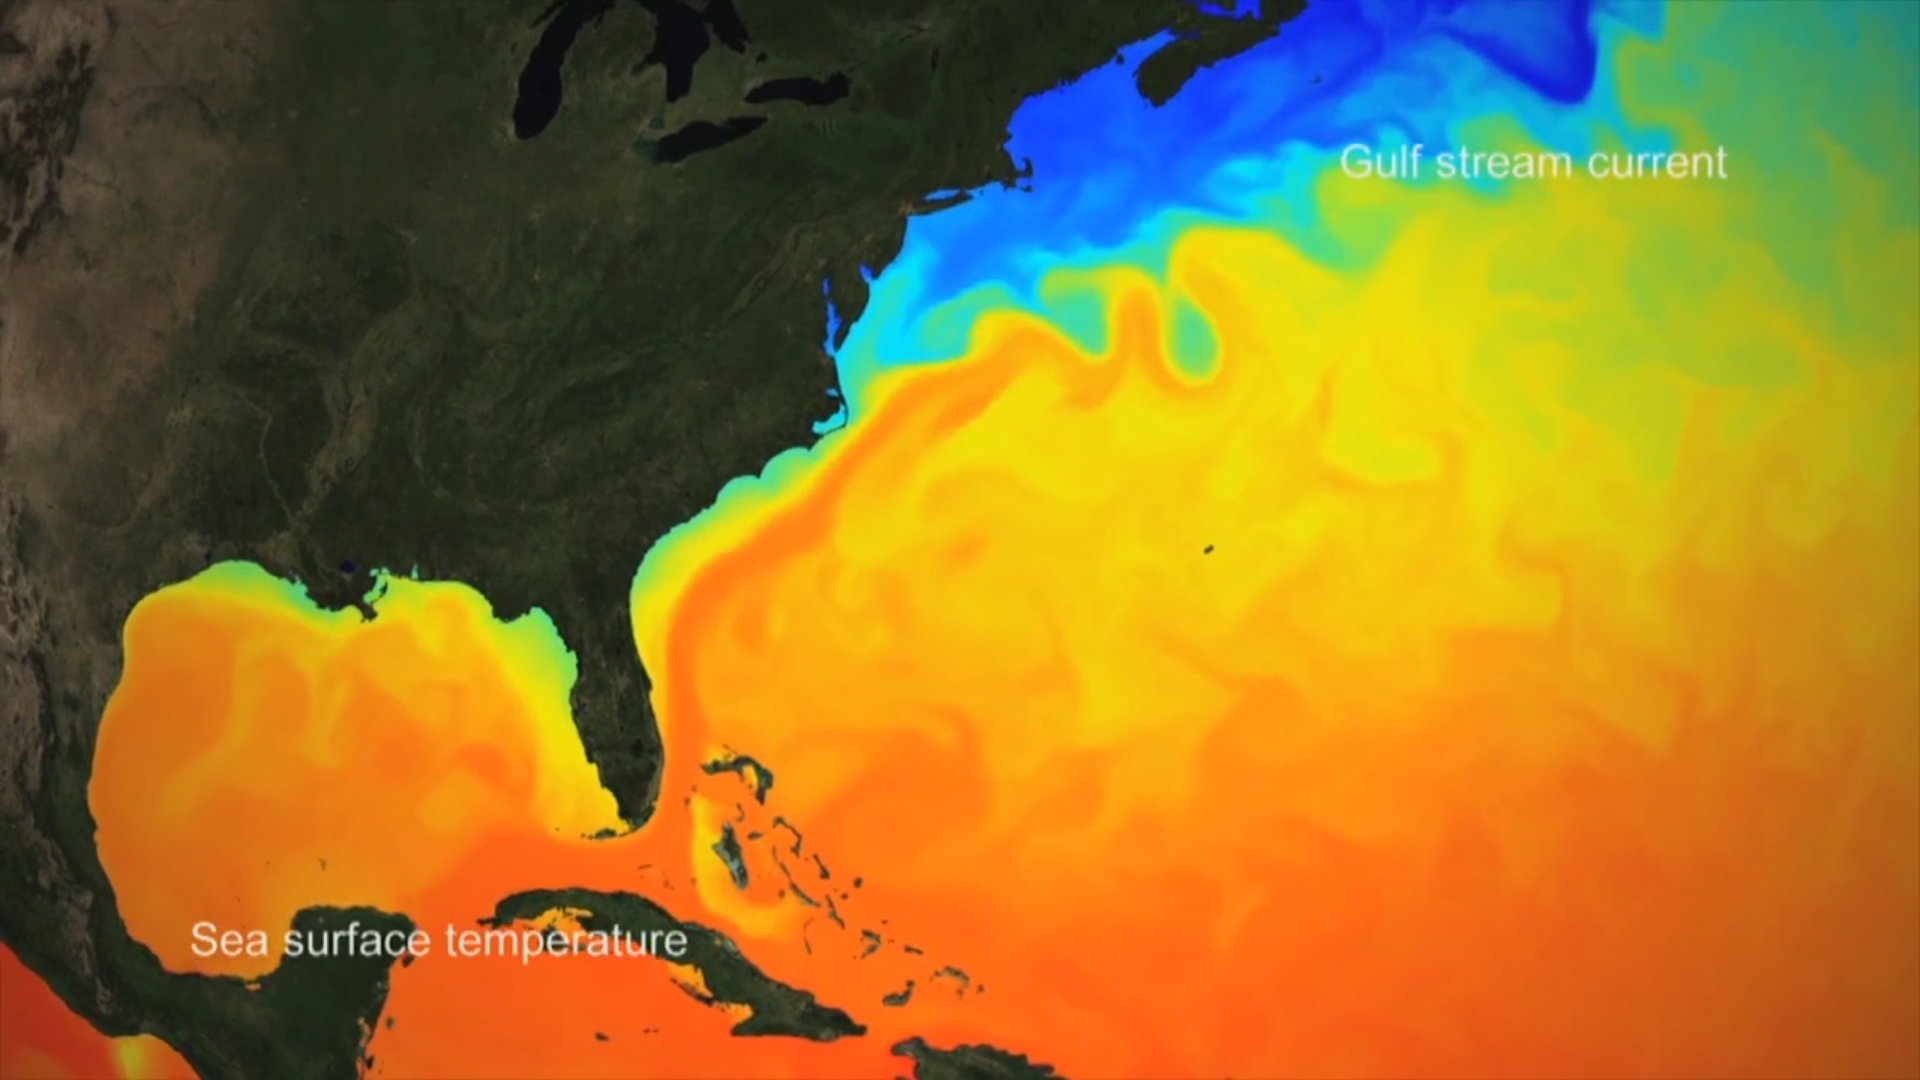
Sea Surface Temperature
Global sea surface temperature data. From high temperatures in orange and yellows, to low temperatures in blues and purples.
©
Copernicus Marine Service/ Mercator Ocean
Source Link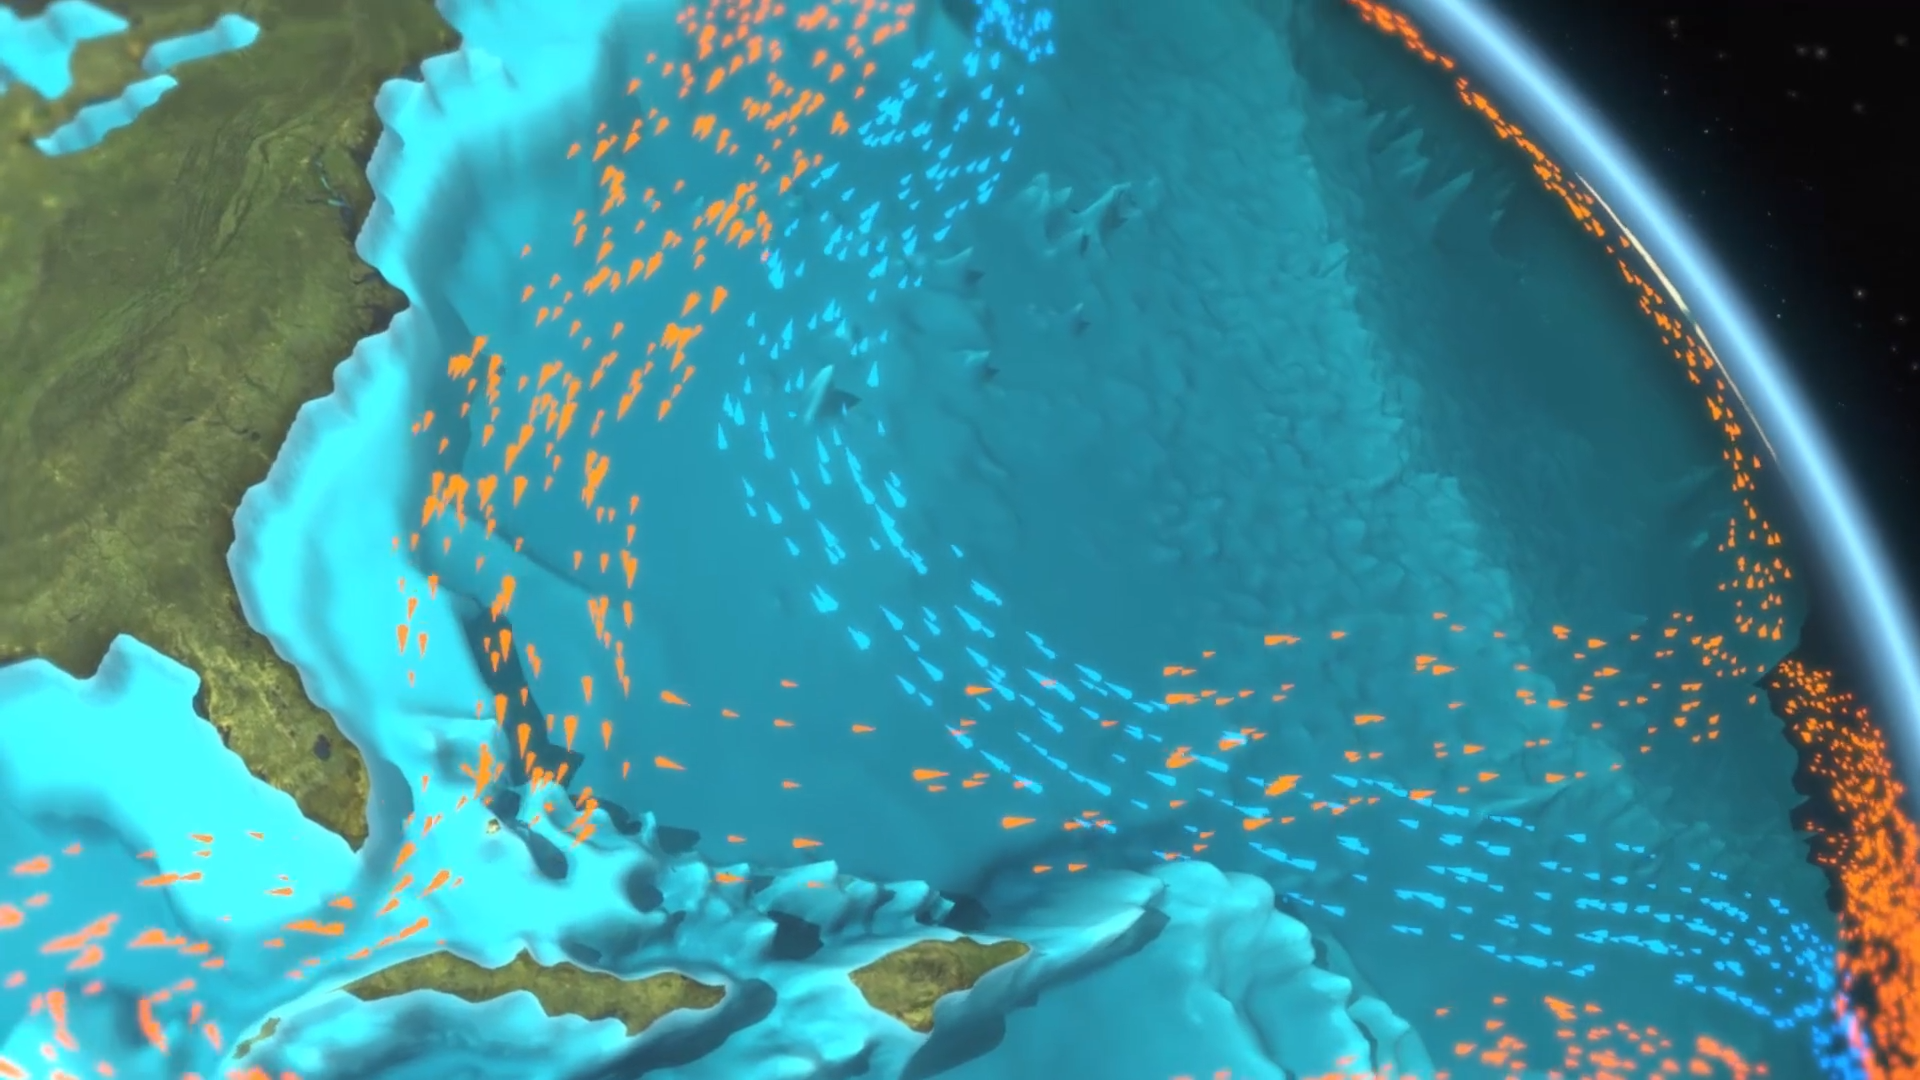
Oceanic Circulation
This video shows ocean circulation currents around the globe
©
Copernicus Marine Service / Mercator Ocean
Source Link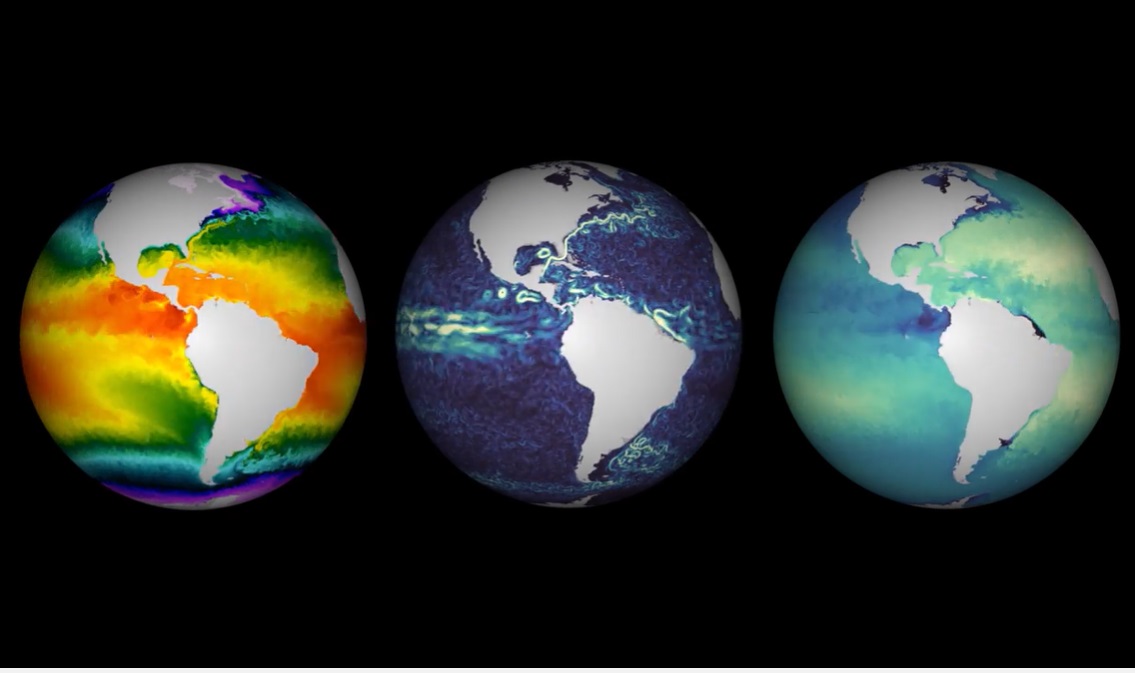
3 Globes
3 globes showing from left, sea surface temperature (SST), ocean currents and ocean salinity
©
Copernicus Marine Service/ Mercator Ocean
Source Link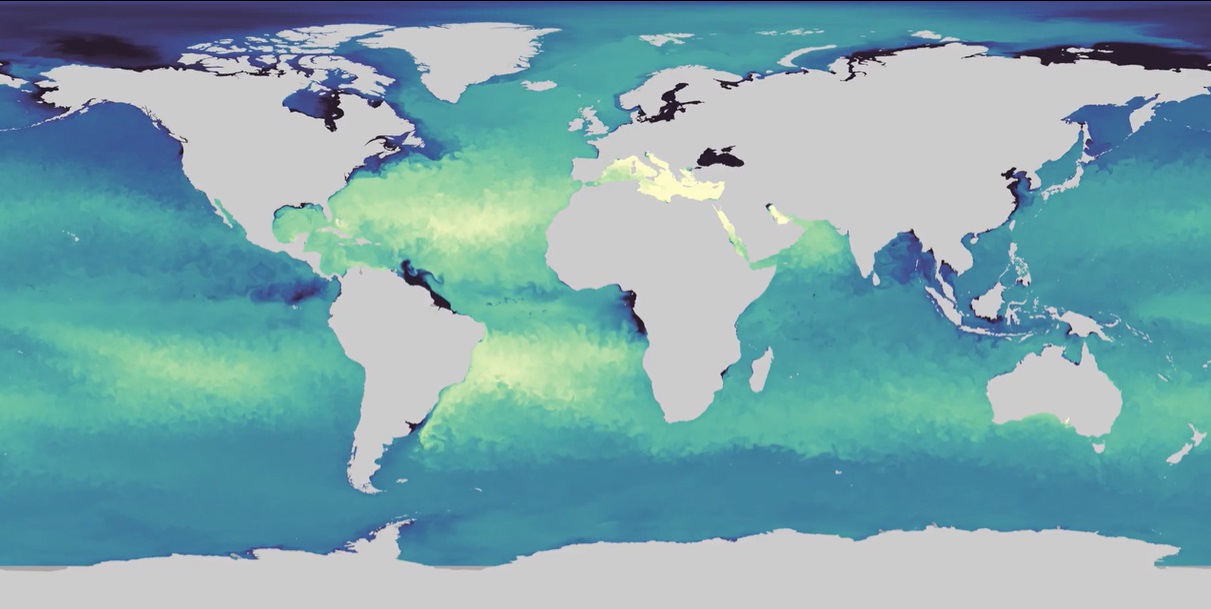
Global Salinity Model
This animations shows global ocean salinity model
©
Copernicus Marine Service/ Mercator Ocean
Source Link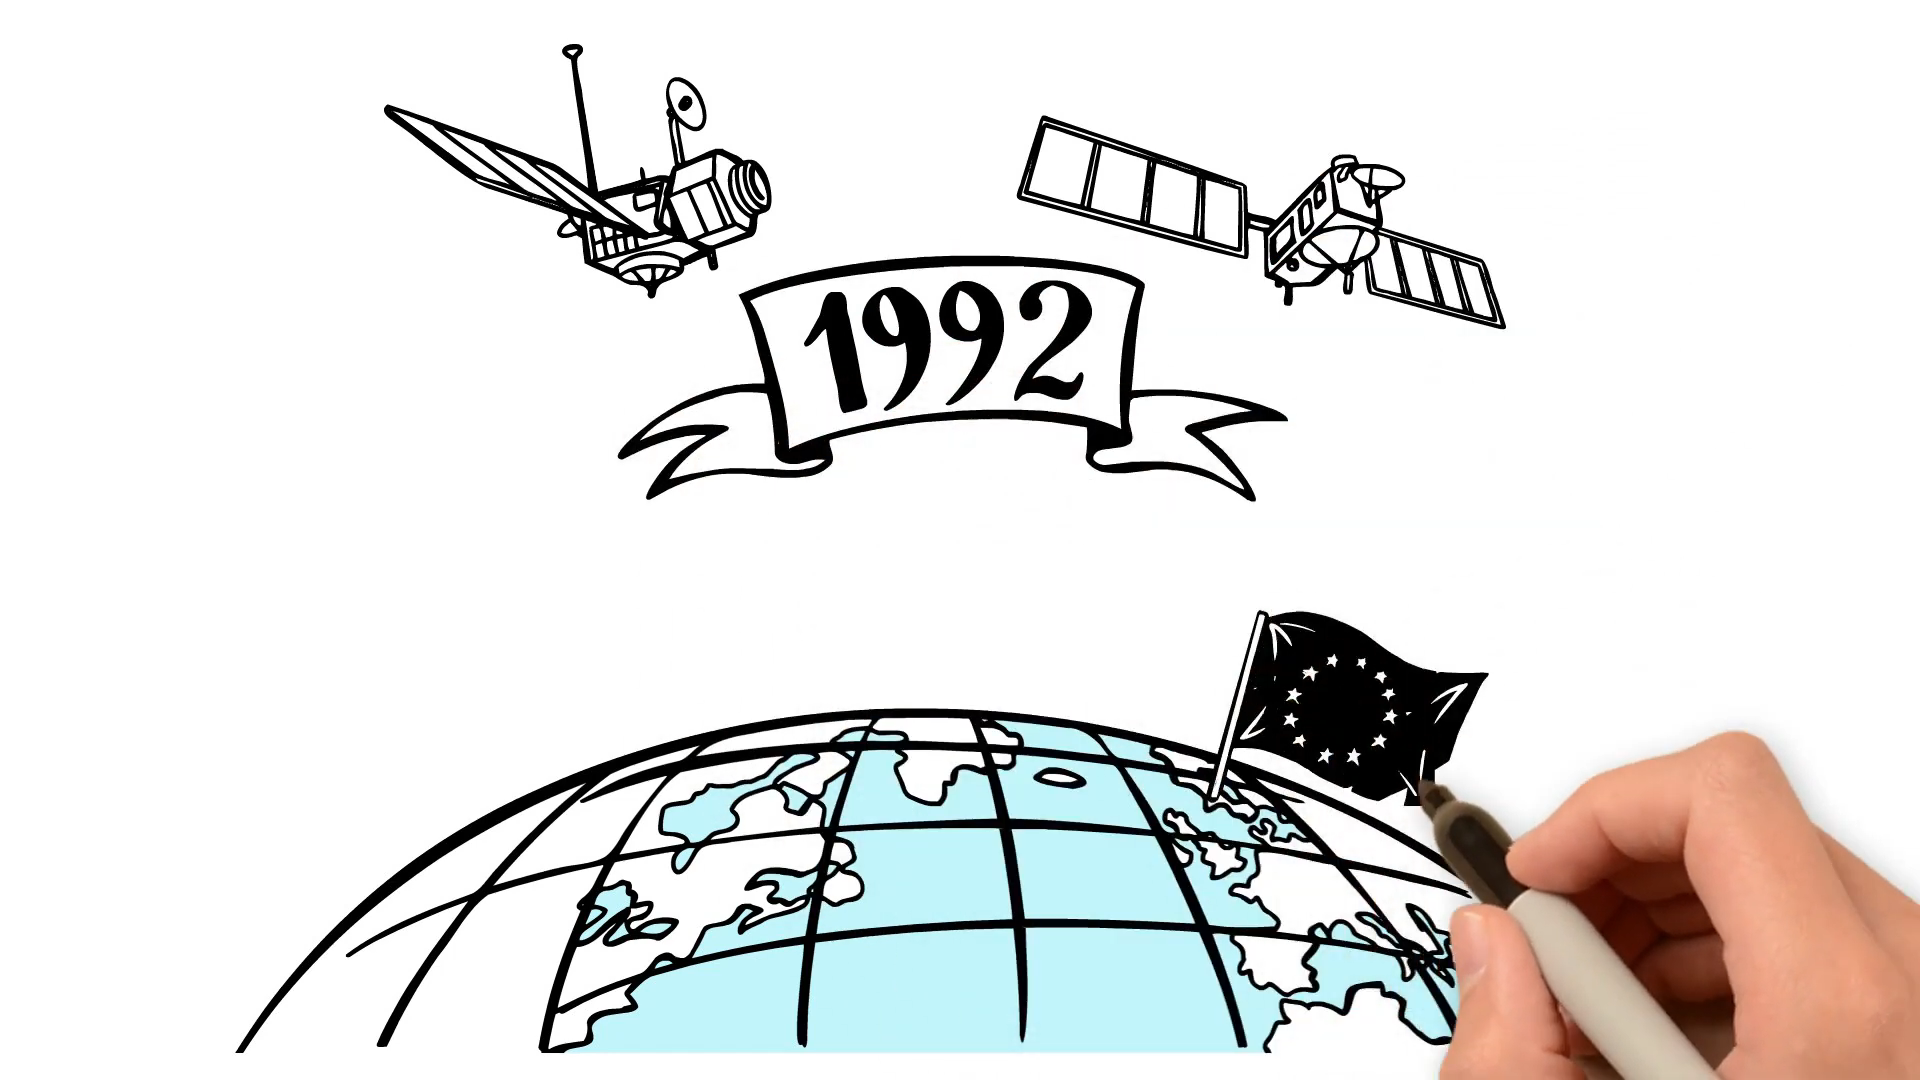
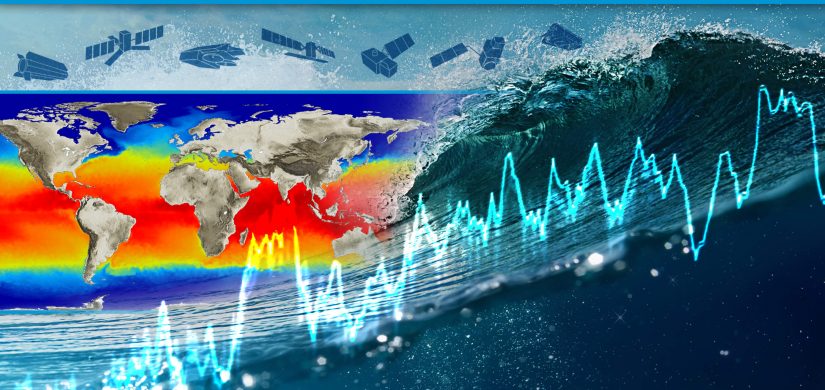
Copernicus Sentinel-6: monitoring the oceans
This ESA-EUMETSAT scribble animation highlights the Copernicus #Sentinel6 mission and the importance of Earth observation satellites, such as Sentinel-6 Michael Freilich, for measuring global sea level.
©
EUMETSAT/ESA
Source Link
Sign up to our newsletter to get updates from Imperative MOOCs
Thank you! Your submission has been received!
Oops! Something went wrong while submitting the form.