

Back to futurelearn
Topic 5A - Introduction To Monitoring The Atmosphere
Featured Images and Example Data
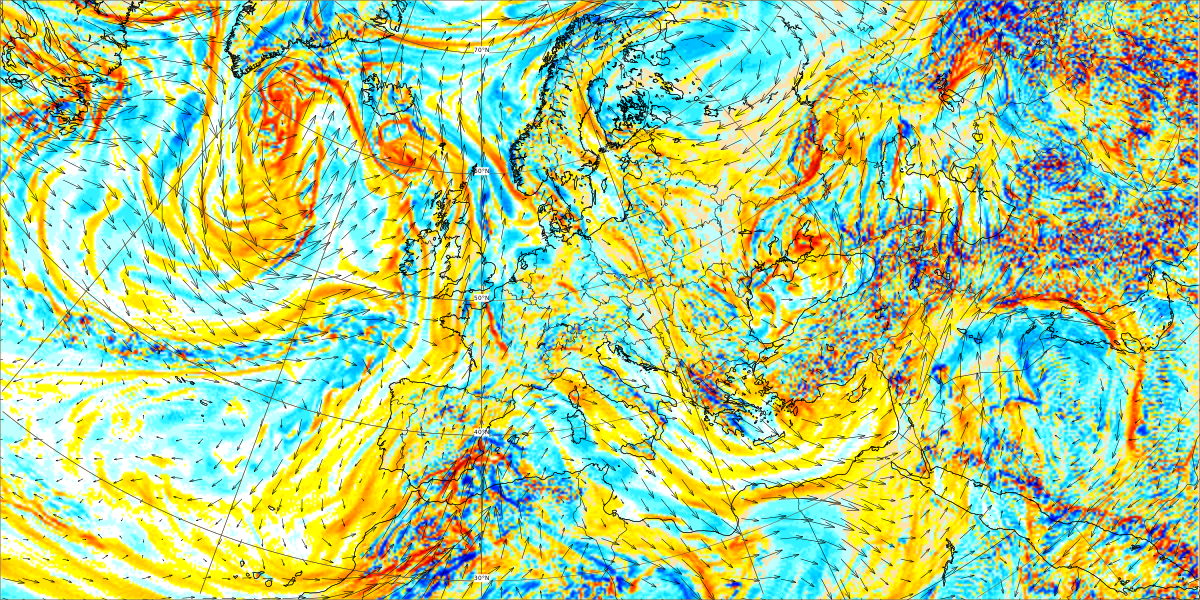
ECMWF Vorticity and Wind at 700 hPa forecast
This is a vorticity (a clockwise or counterclockwise spin in the troposphere) and wind forecast. The brown arrows are wind vectors, and the coloured fields denote relative vorticity
©
ECMWF
Source Link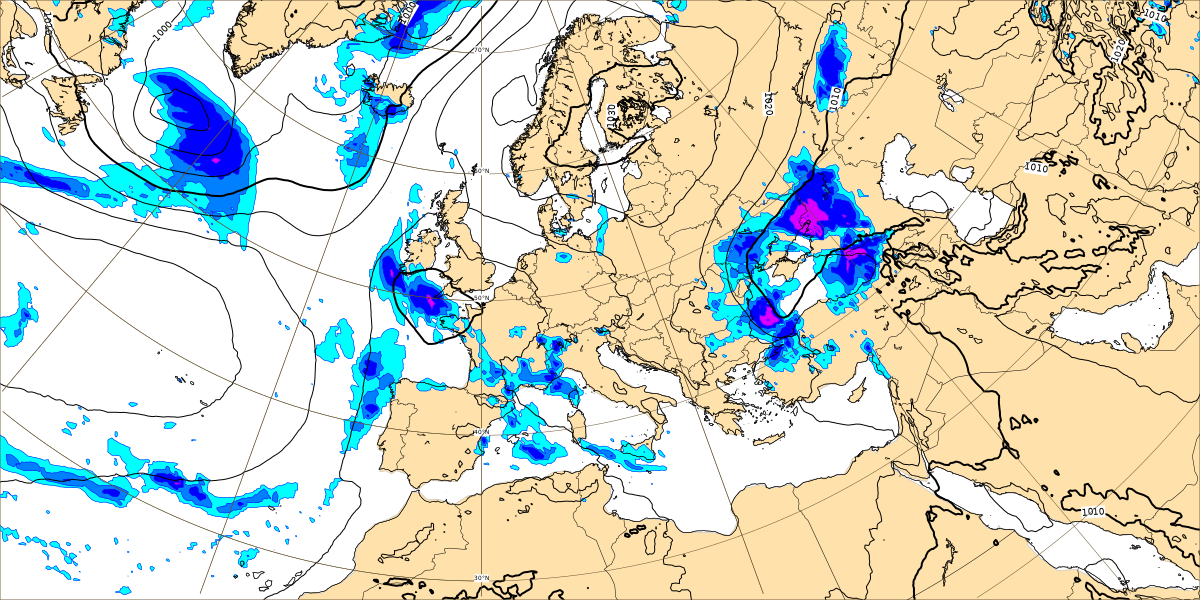
ECMWF Rain and mean sea level forecast
This image shows a ECMWF mean sea level pressure and 6h/12h precipitation forecast for Europe. Precipitation is represented using colour shades.
©
ECMWF
Source LinkFeatured Video and Animations
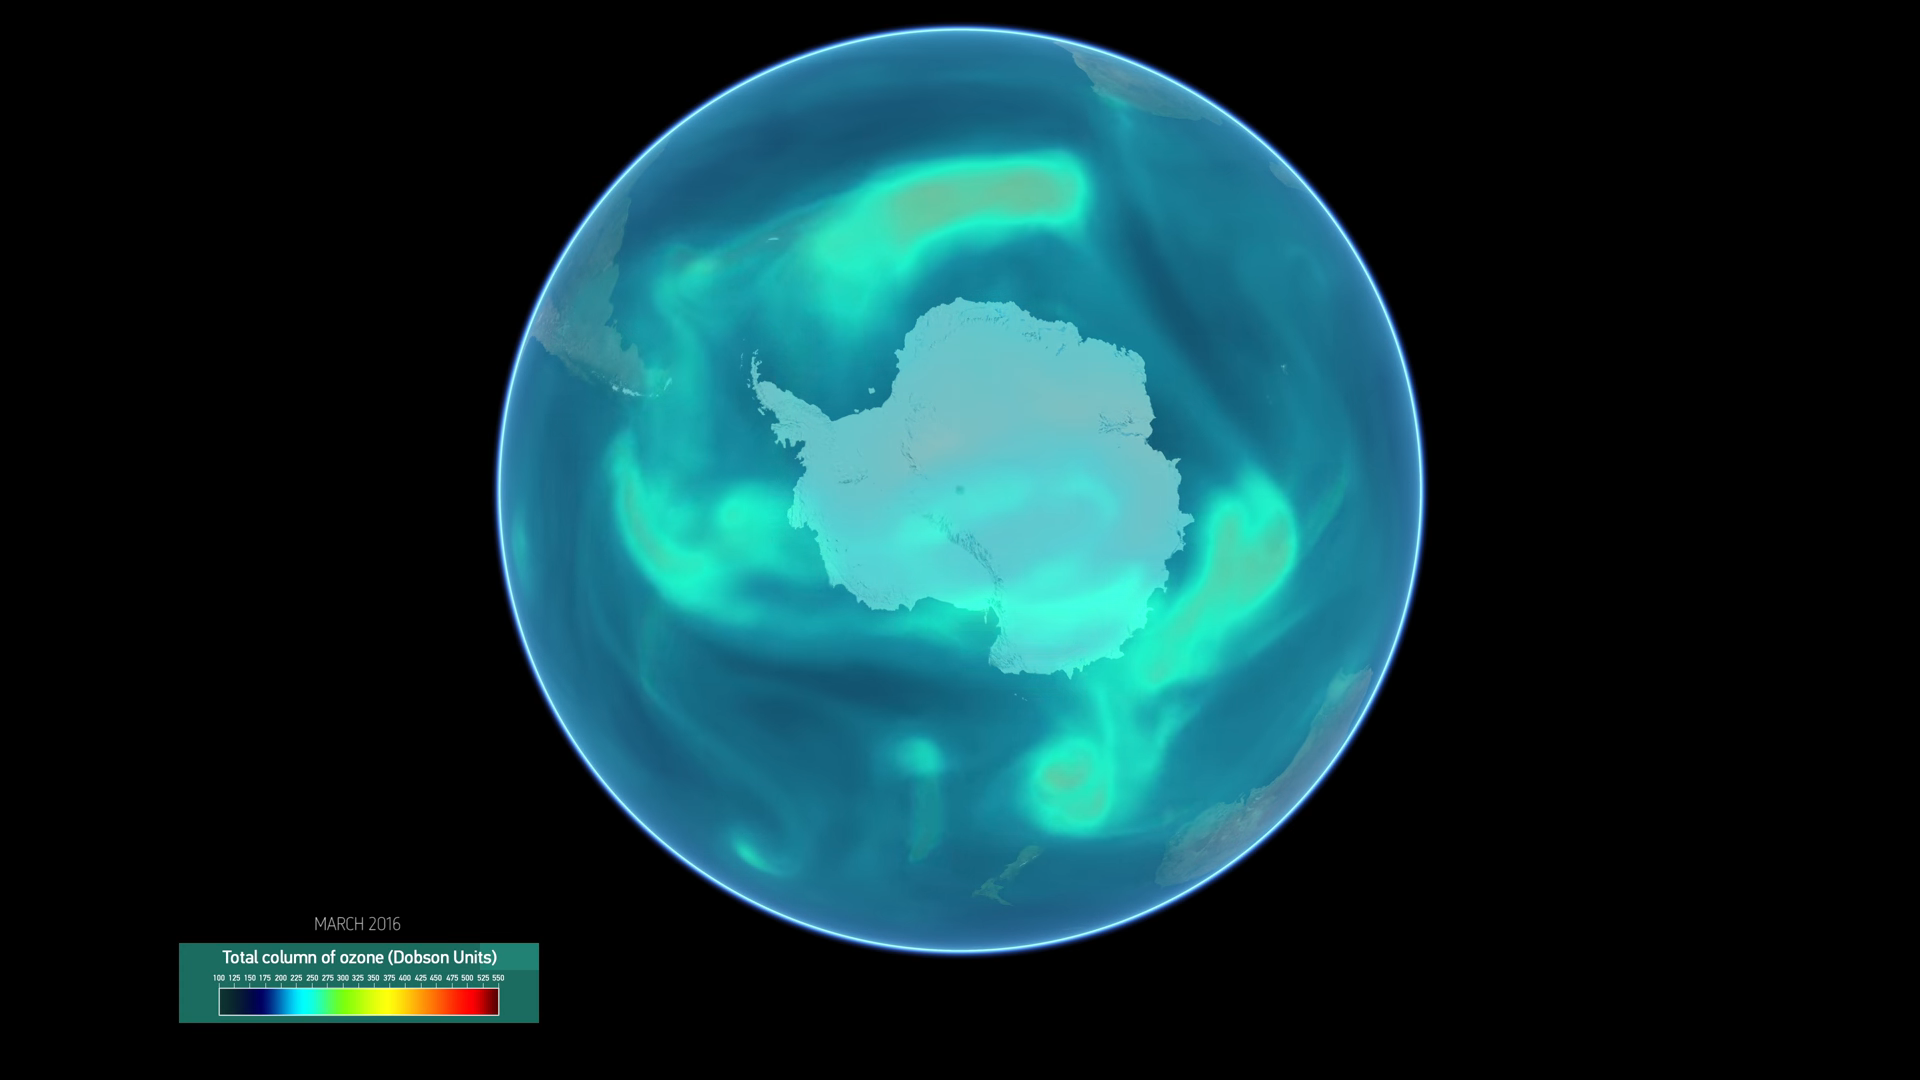
A year of polar ozone - 2016
A visualisation of polar ozone levels throughout 2016, with audio commentary from Ruediger Lang, Atmospheric Composition Scientist and Product Lead at EUMETSAT.
©
EUMETSAT
Source Link
Sentinel-5P: Bringing Air Pollution into Focus
Animation of Sentinel-5p mapping trace gases such as nitrogen dioxide, ozone, formaldehyde, sulphur dioxide, methane, carbon monoxide and aerosols
©
ESA/ATG medialab
Source Link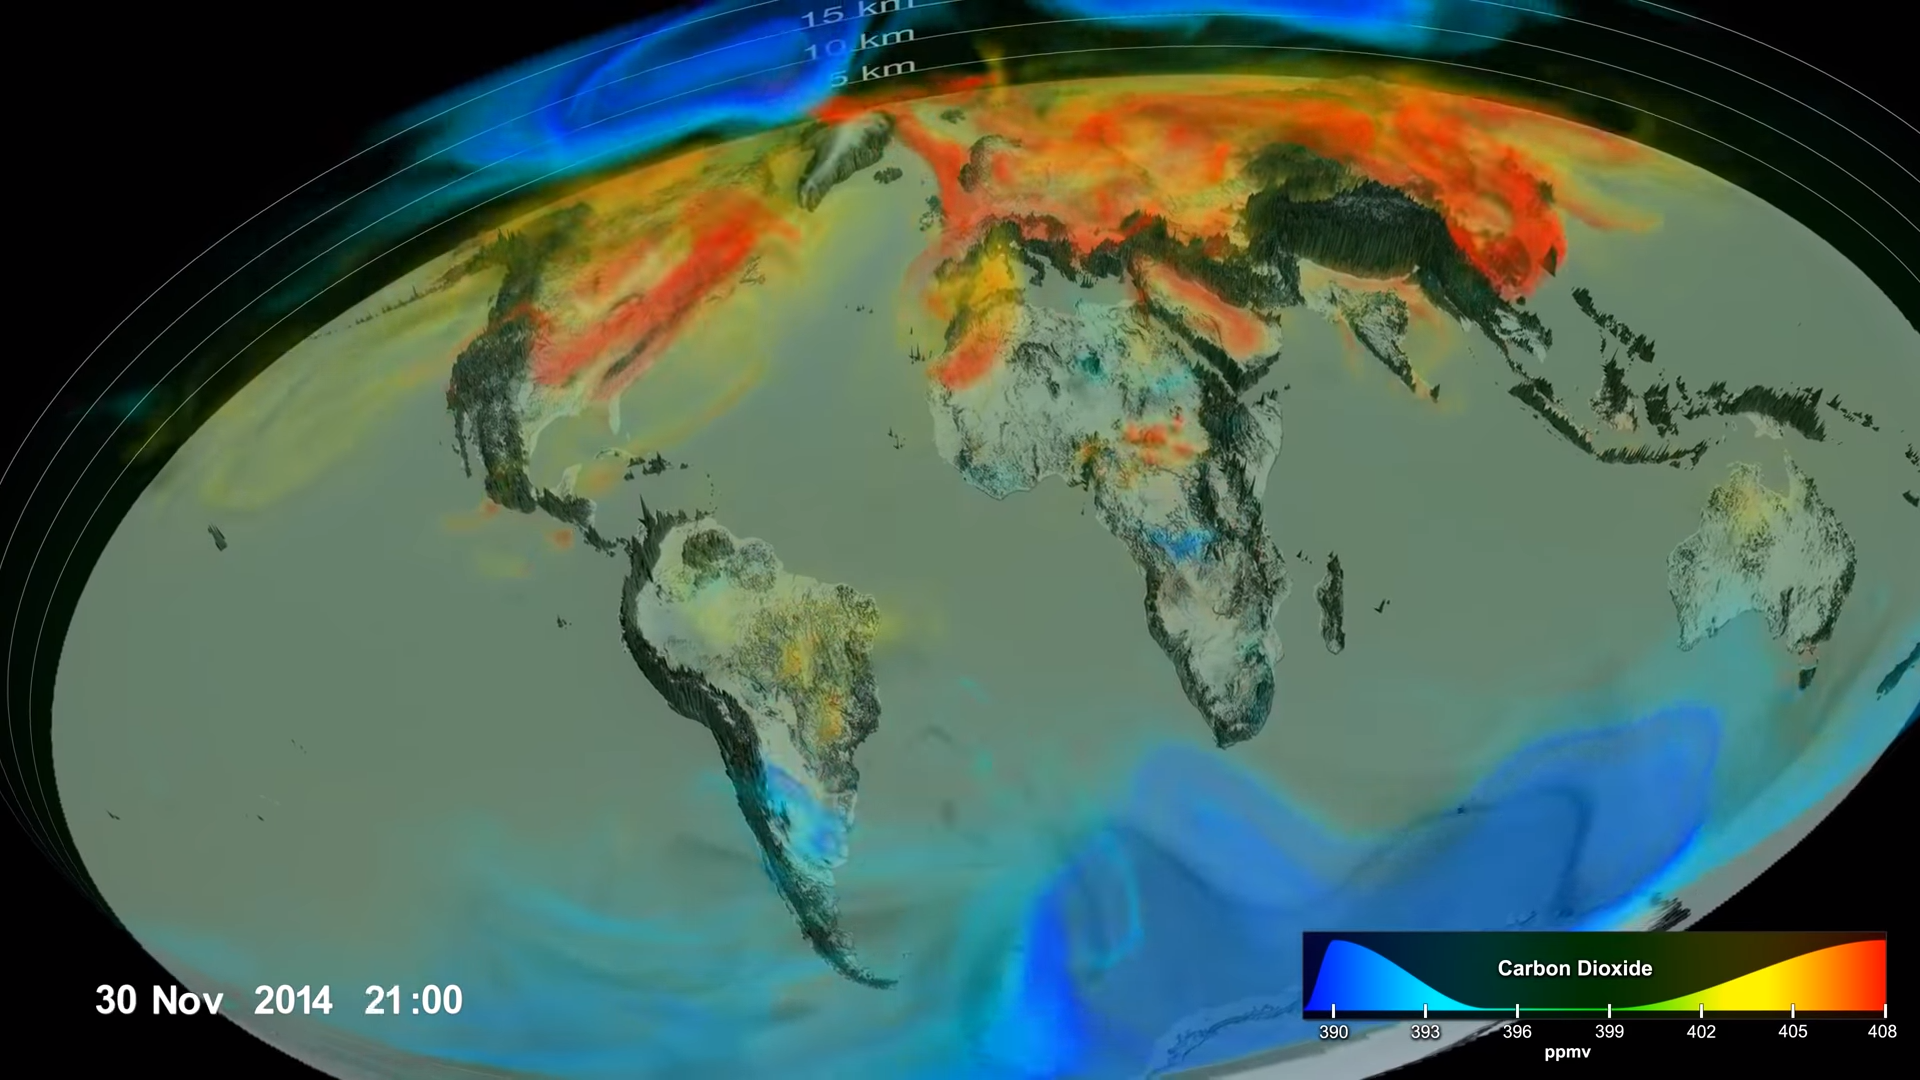
Following Carbon Dioxide through the atmosphere
Using observations from NASA's Orbiting Carbon Observatory (OCO-2) satellite, scientists developed a model of the behavior of carbon in the atmosphere from September 1, 2014 to August 31, 2015.
©
NASA's Goddard Space Flight Center
Source Link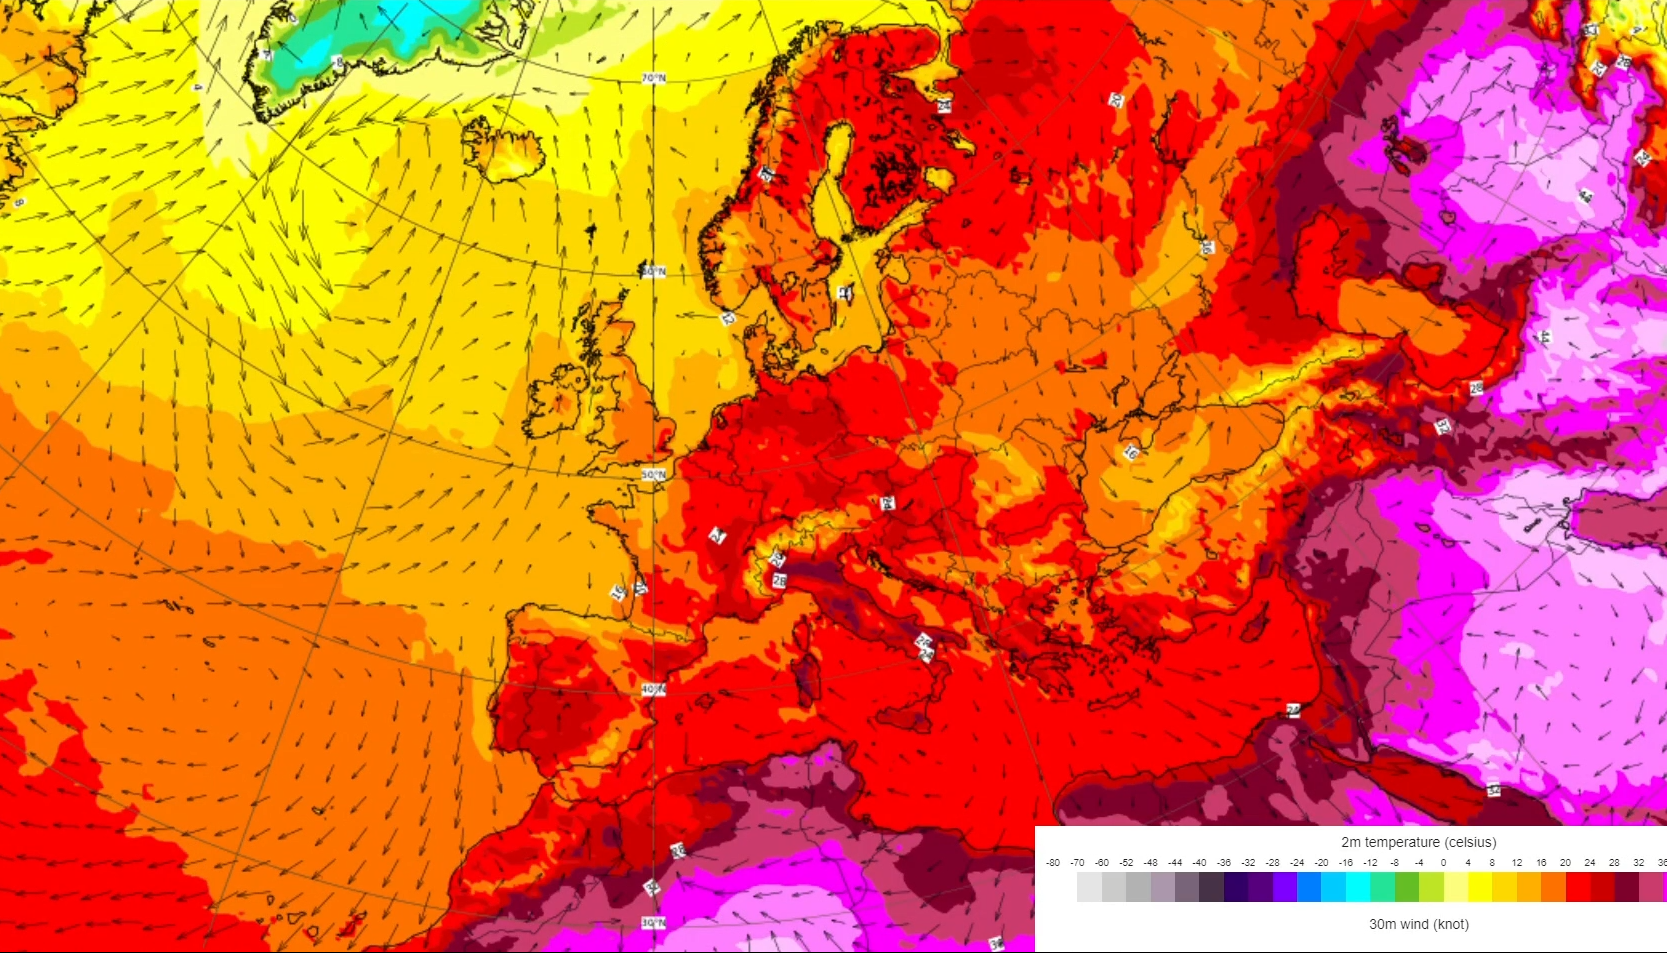
ECMWF temperature and winds forecast
This is a ECMWF 2m temperature (colour shading,) and 30m winds (shown as black arrows) forecast for 2nd - 12th June 2021
©
ECMWF
Source Link
NOx emissions decline in European lockdowns 2020 Vs business as usual
Animation of the absolute cumulative NOx emission decline in 2020 as compared to the business-as-usual scenario, still 10 April 2020
©
Copernicus Atmosphere Monitoring Service/ECMWF/BSC
Source Link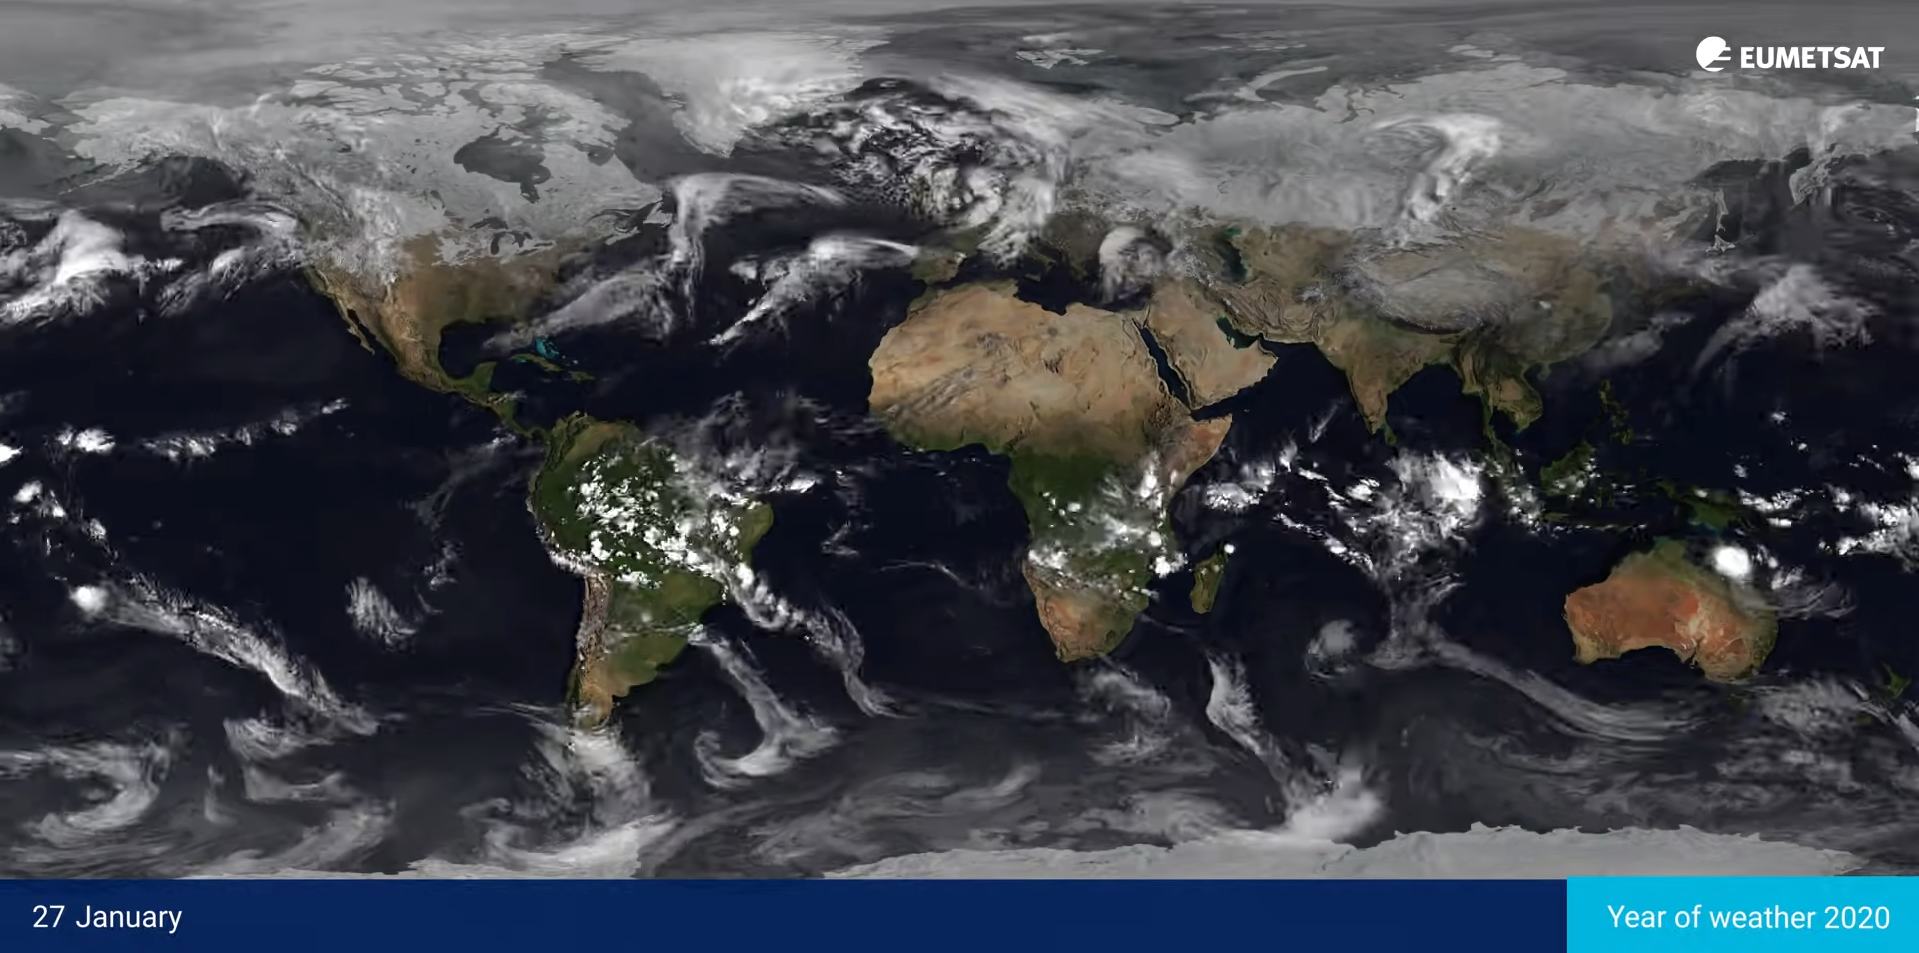
A Year of Weather 2020
This animation shows the different weather patterns across the globe in 2020 as captured from space, with major storms labelled from light yellow to red depending on their intensity. The most active basin of the year was the North Atlantic, counting 30 named storms.
©
EUMETSAT
Source Link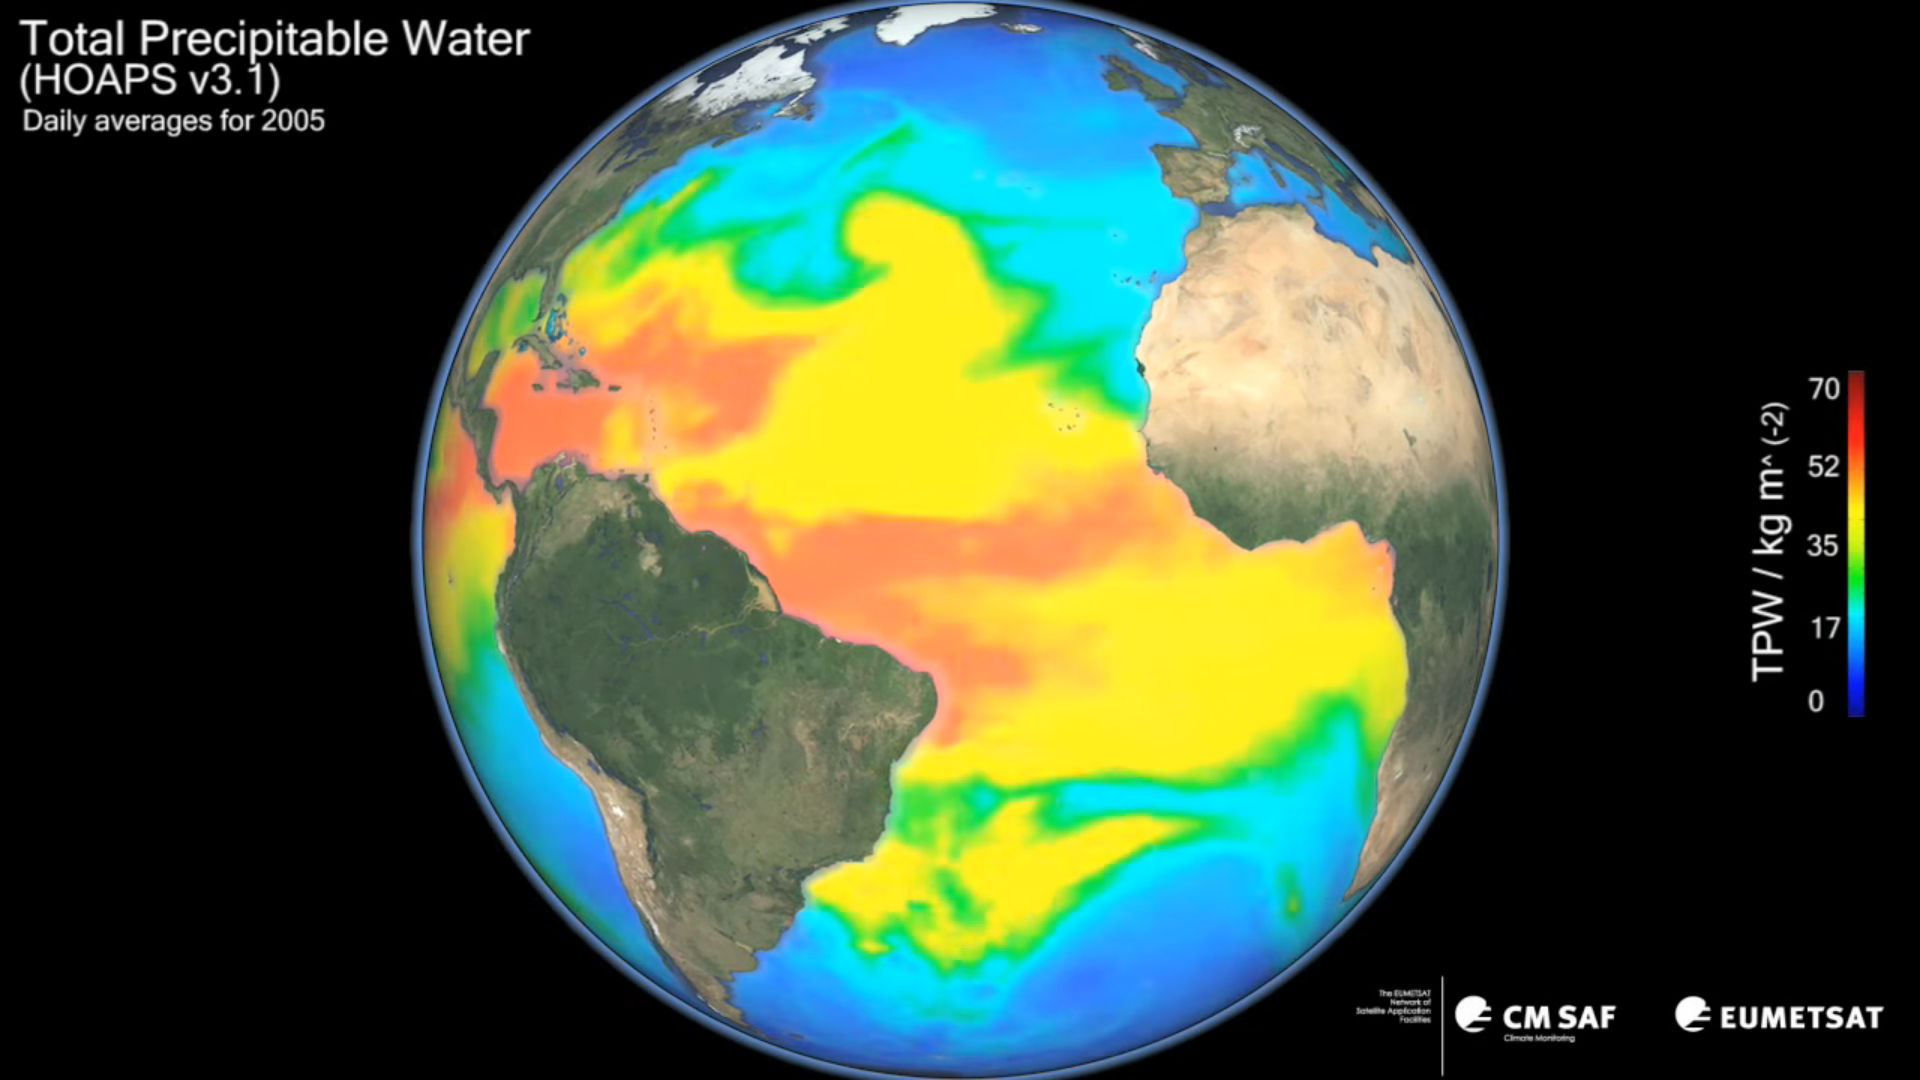
Atmospheric Water Vapour
The Total Precipitable Water product, visualised in this animation, illustrates the average daily water vapour content in the atmosphere over the oceans throughout 2005. Importantly, the extended period of satellite observations available allow climatologists to see patterns and trends over a 20-year period.
©
EUMETSAT
Source Link
Sign up to our newsletter to get updates from Imperative MOOCs
Thank you! Your submission has been received!
Oops! Something went wrong while submitting the form.